Copyright
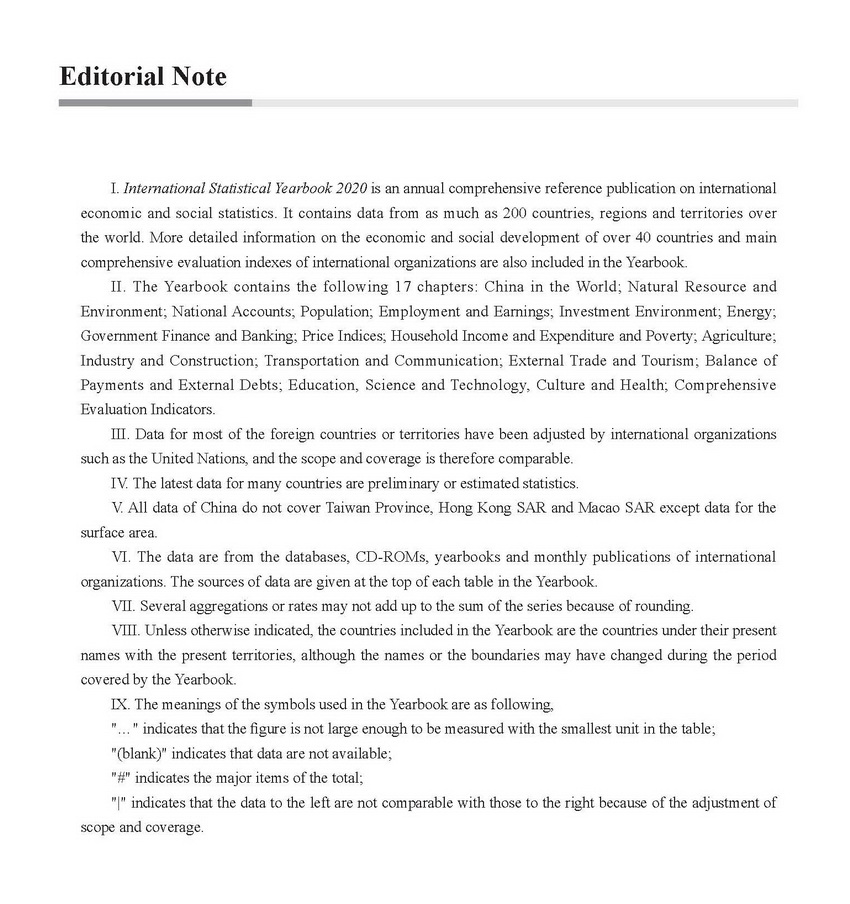
Editorial Note
Editorial Board and Editorial Staff
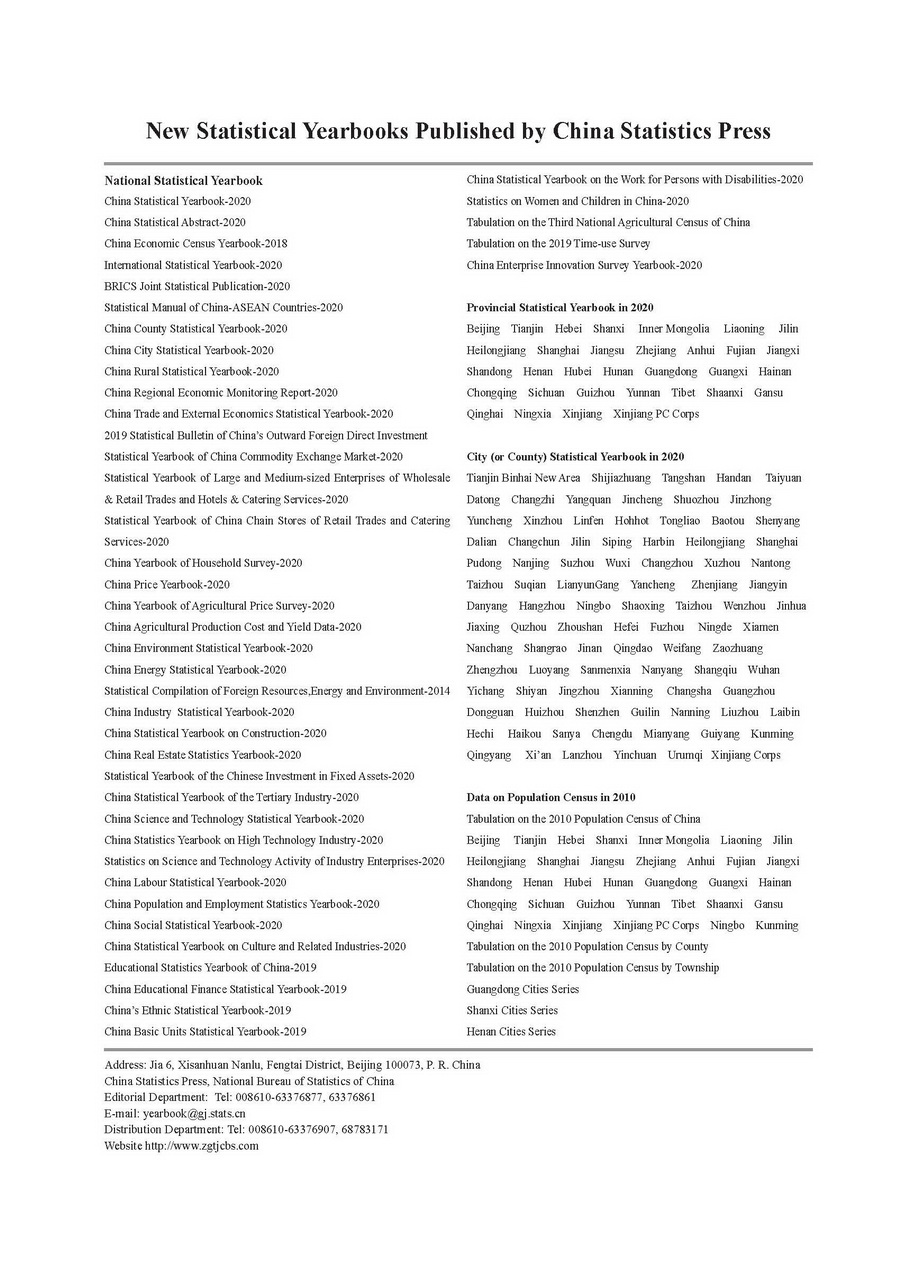
New Statistical Yearbooks Published by China Statistics Press
China in the World
Ranking of China in the World in Terms of Main Indicators
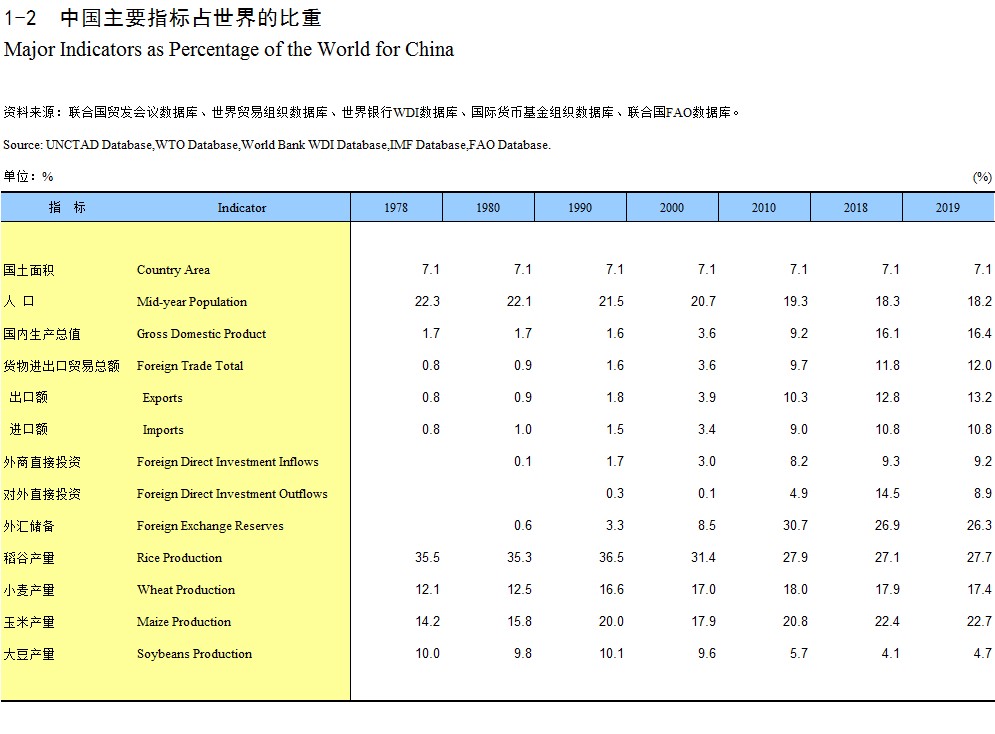
Major Indicators as Percentage of the World for China
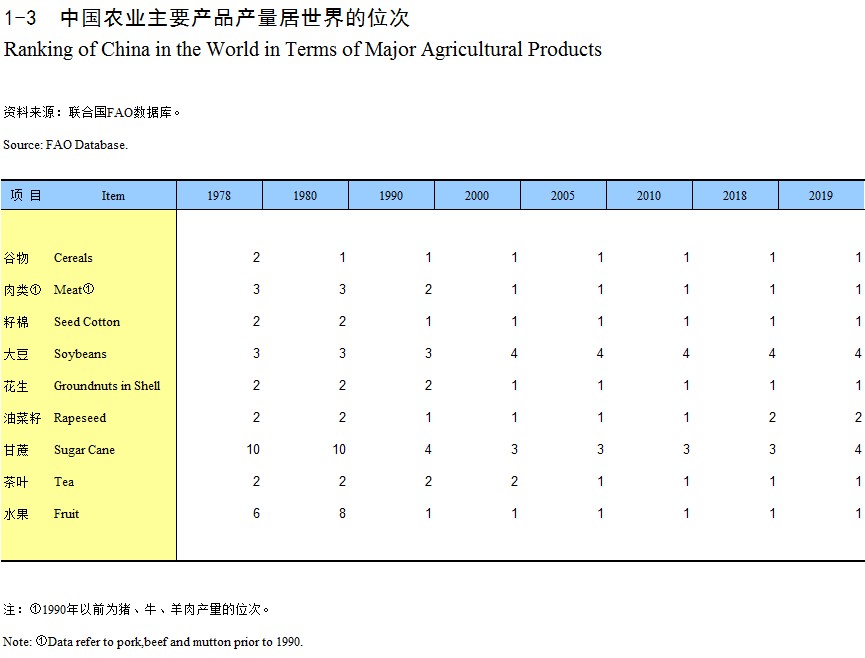
Ranking of China in the World in Terms of Major Agricultural Products
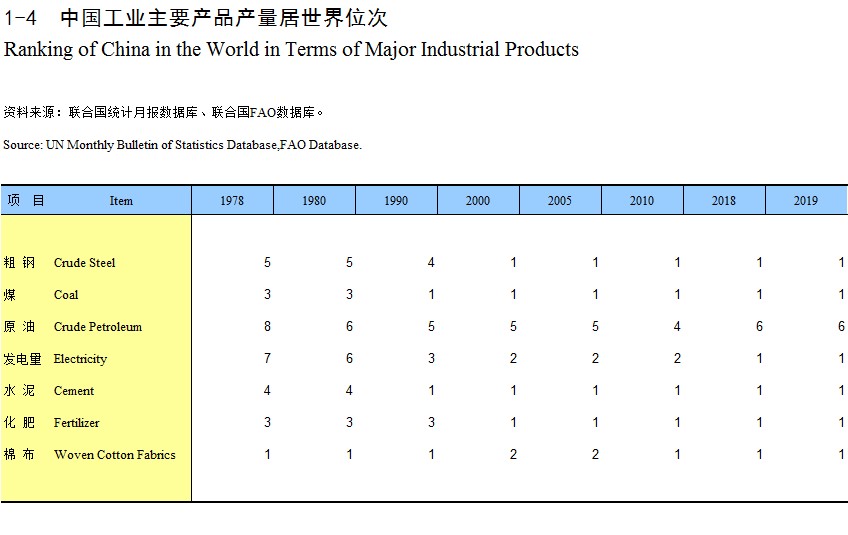
Ranking of China in the World in Terms of Major Industrial Products
Natural Resource and Environment
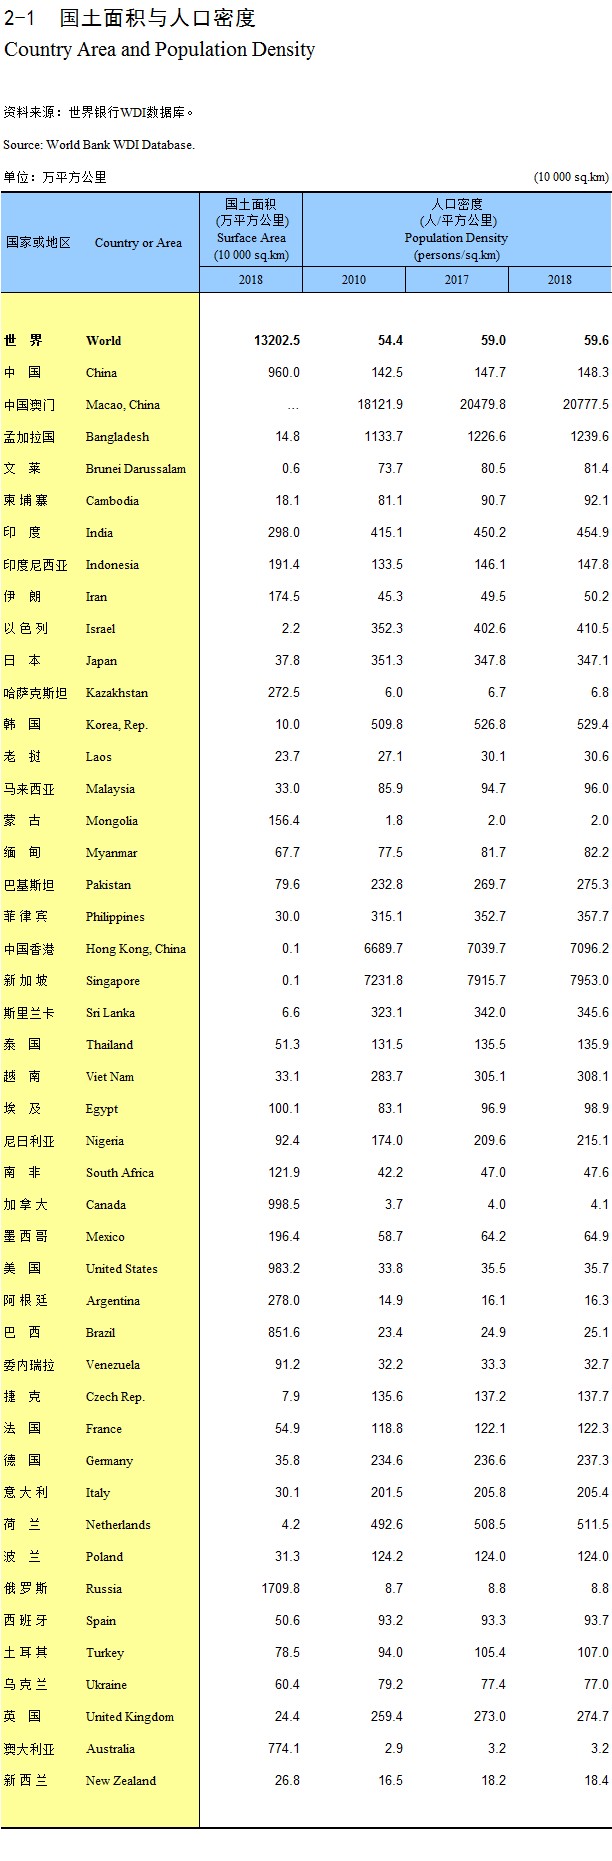
Country Area and Population Density
Land Utilization (2018)
Freshwater
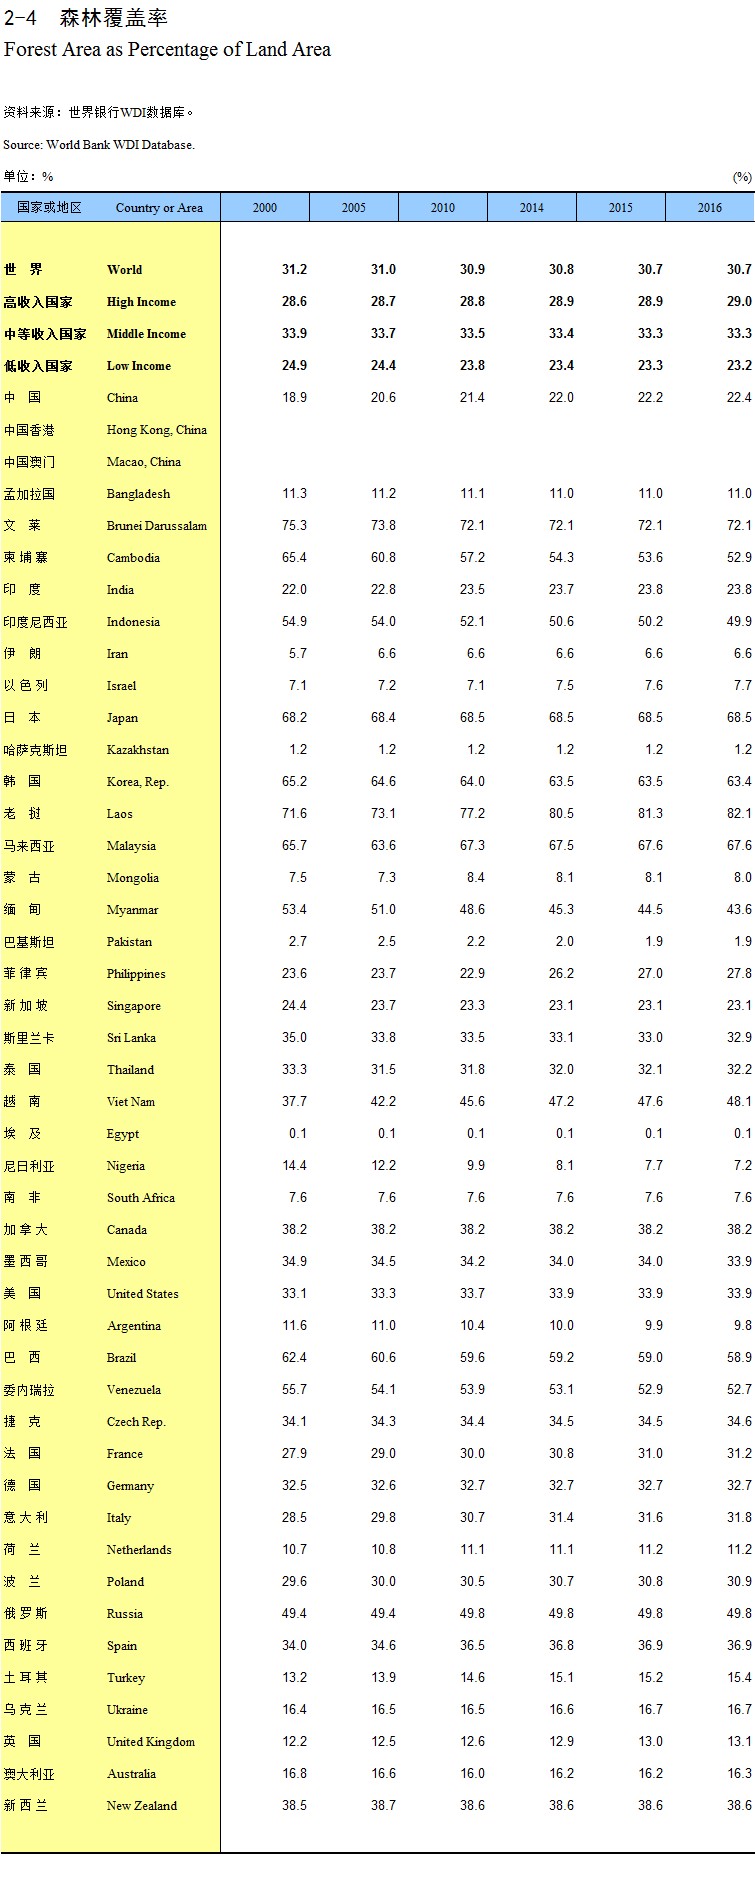
Forest Area as Percentage of Land Area
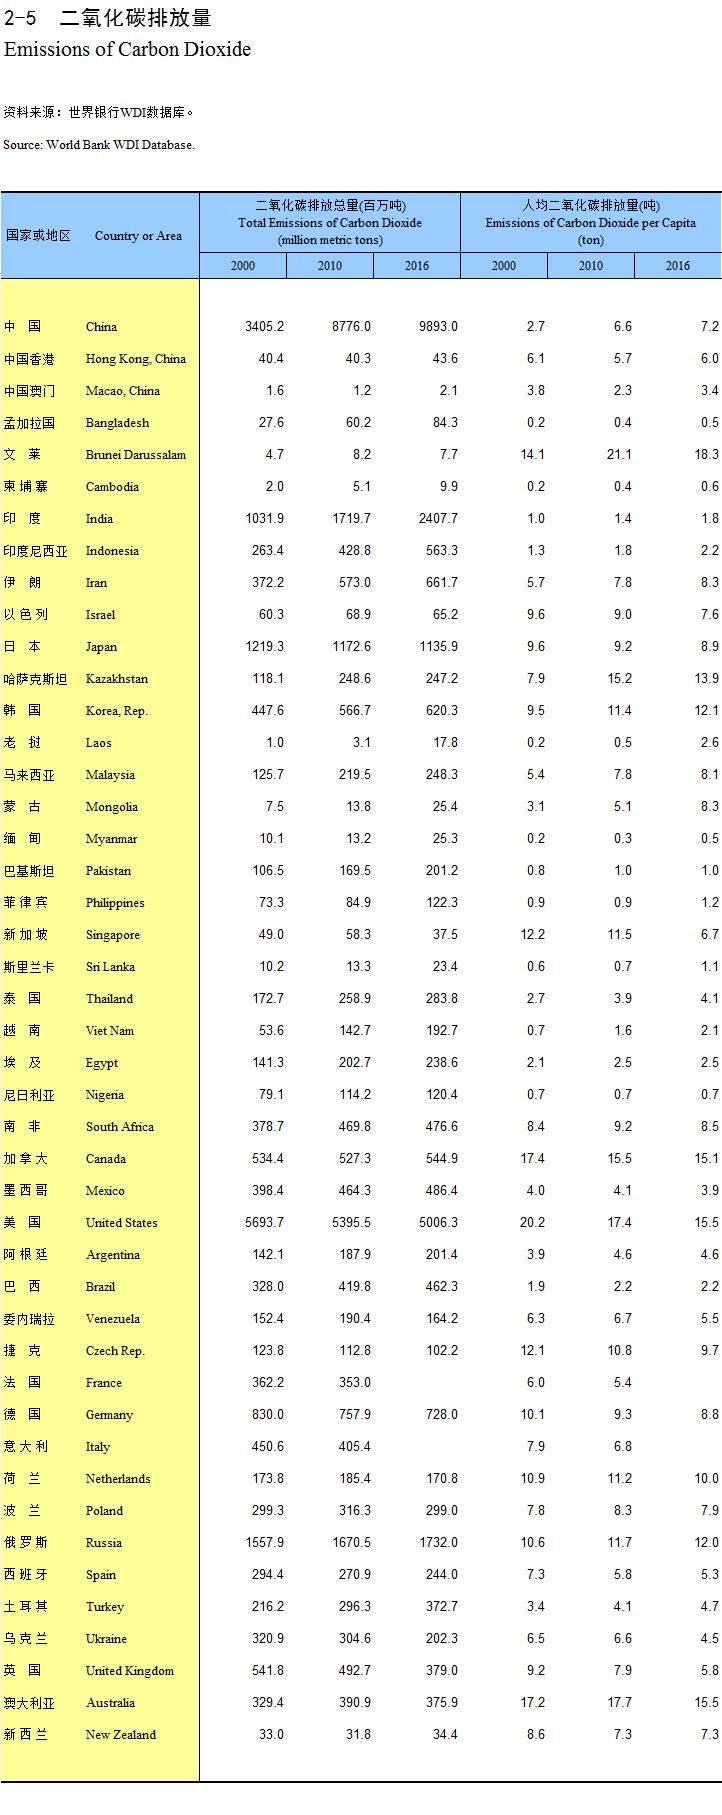
Emissions of Carbon Dioxide
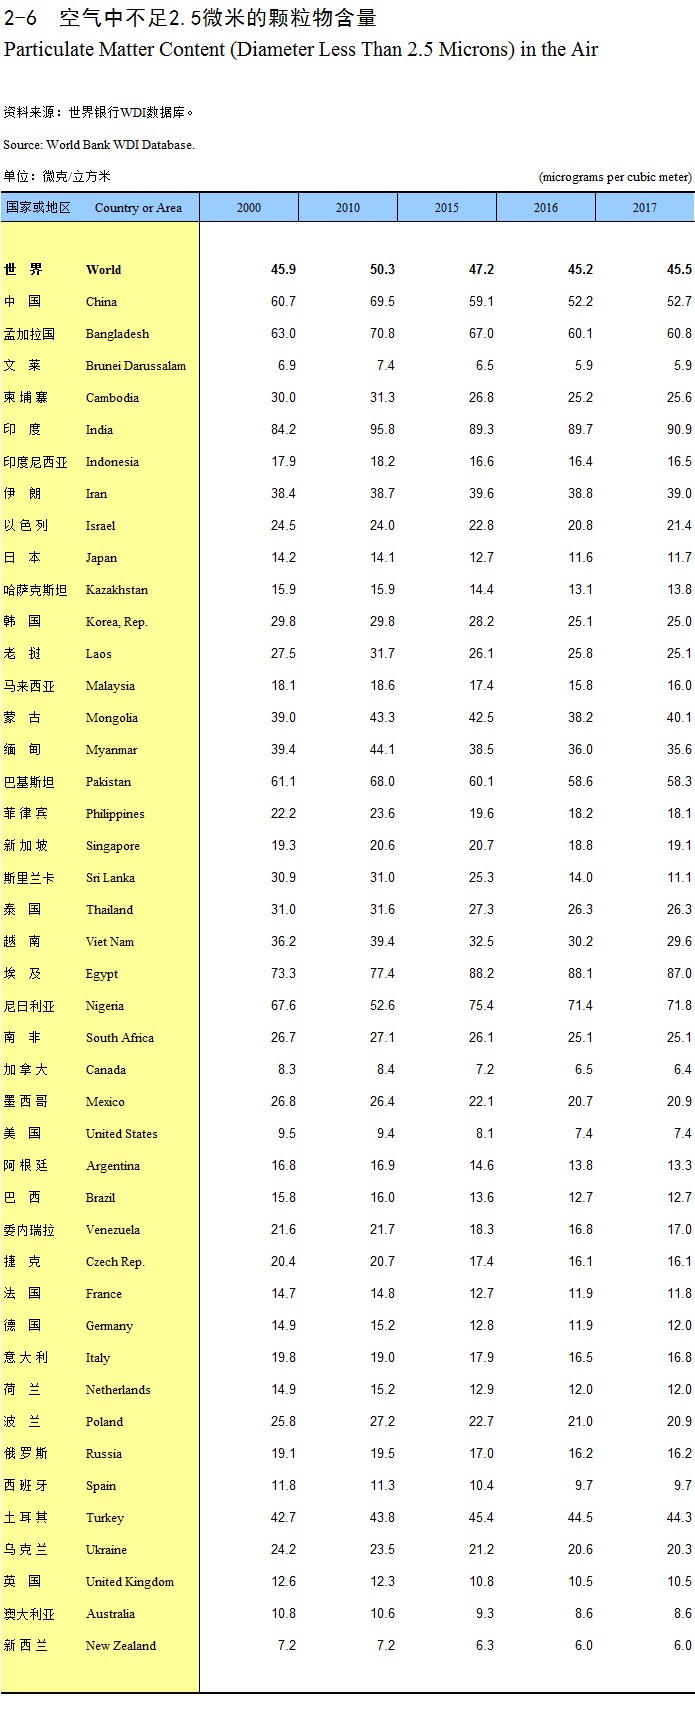
Particulate Matter Content (Diameter Less Than 2.5 Microns) in the Air
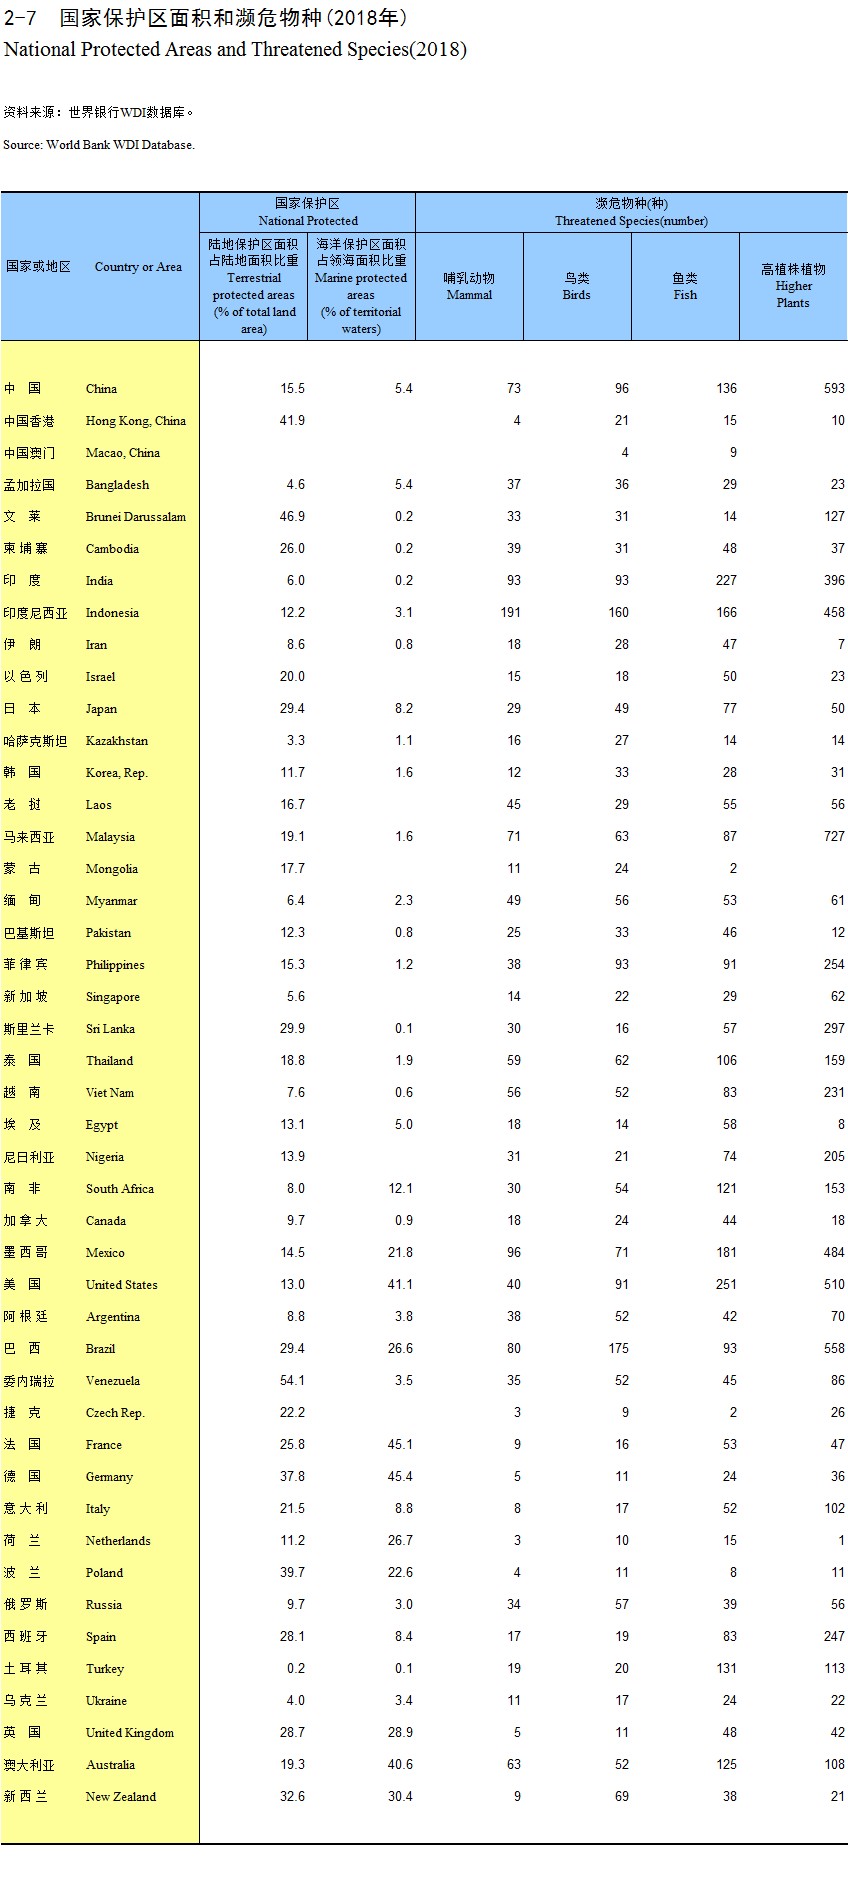
National Protected Areas and Threatened Species (2018)
Explanatory Notes on Main Statistical Indicators
National Accounts
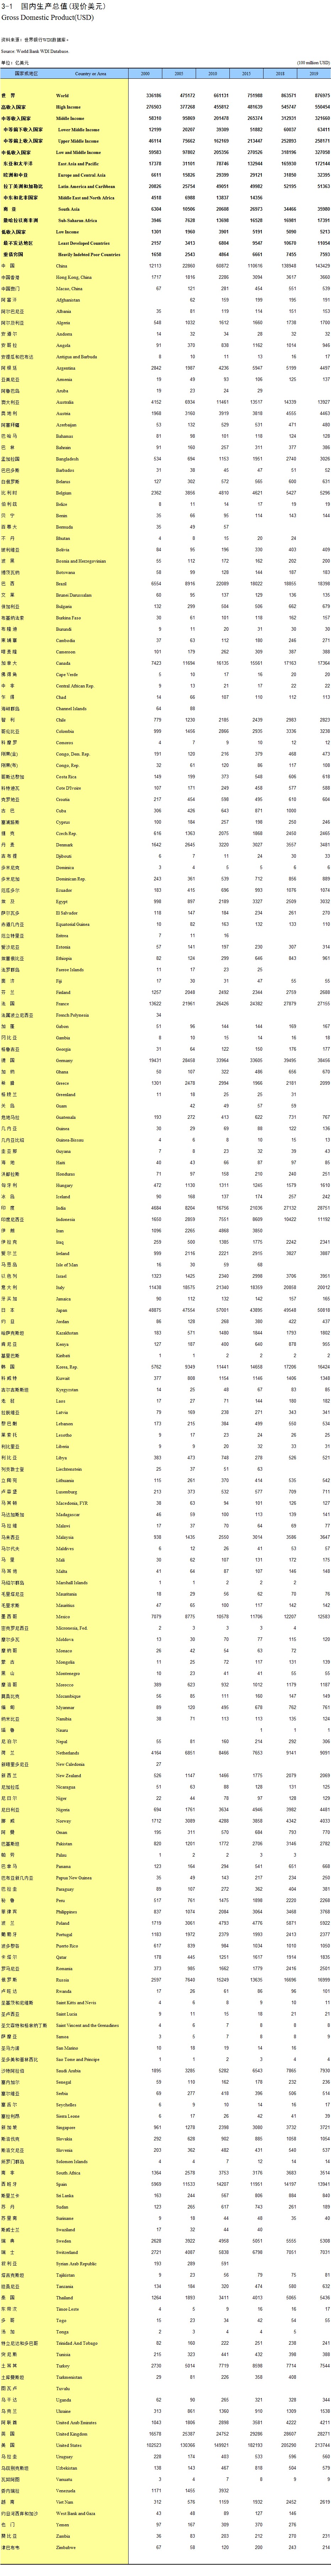
Gross Domestic Product (USD)
GDP per Capita
GNI per Capita
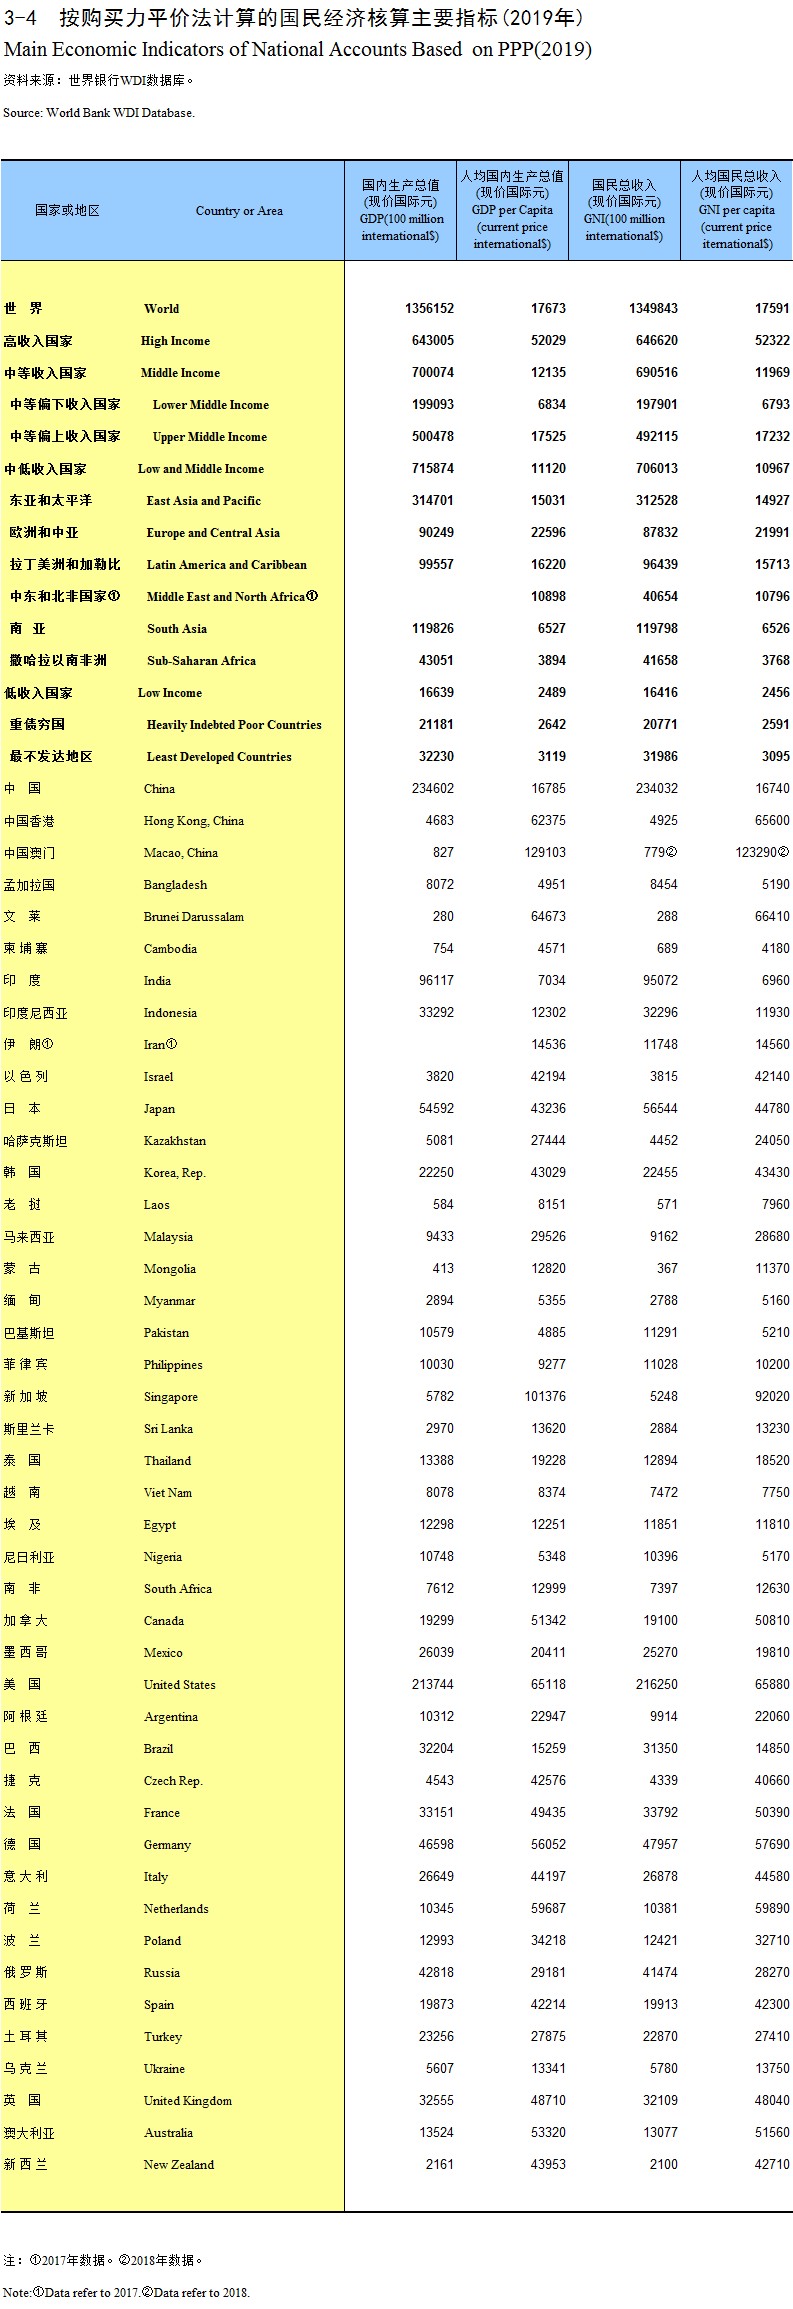
Main Economic Indicators of National Accounts Based on PPP (2019)
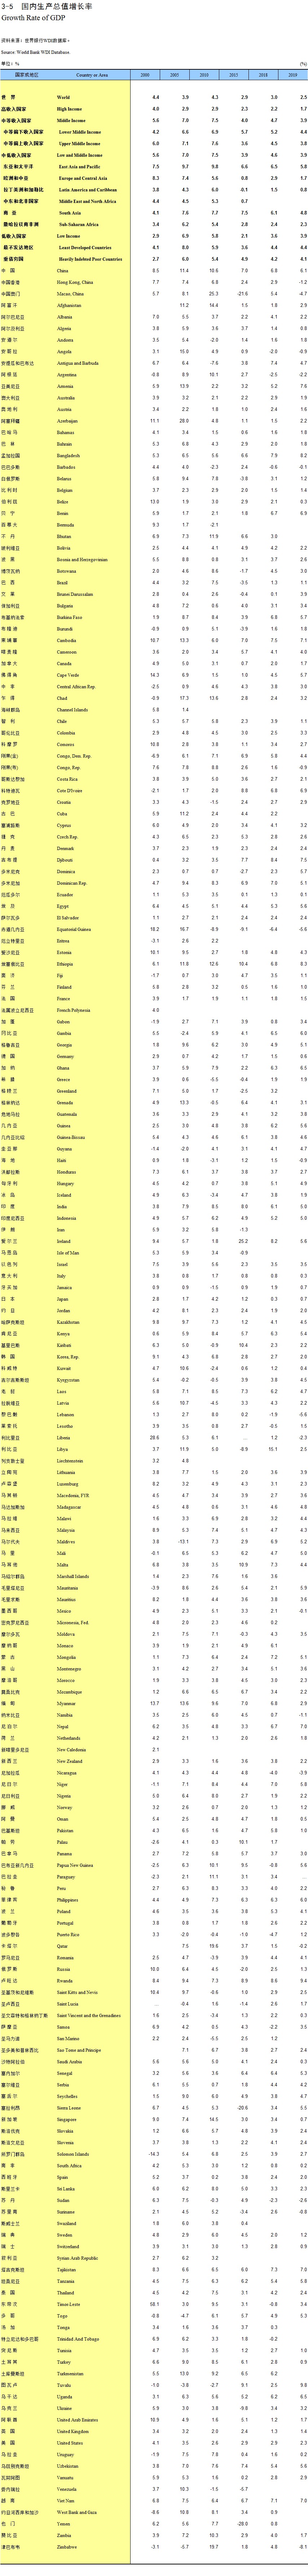
Growth Rate of GDP
Growth rate of GDP per capita
Capital Formation Rate
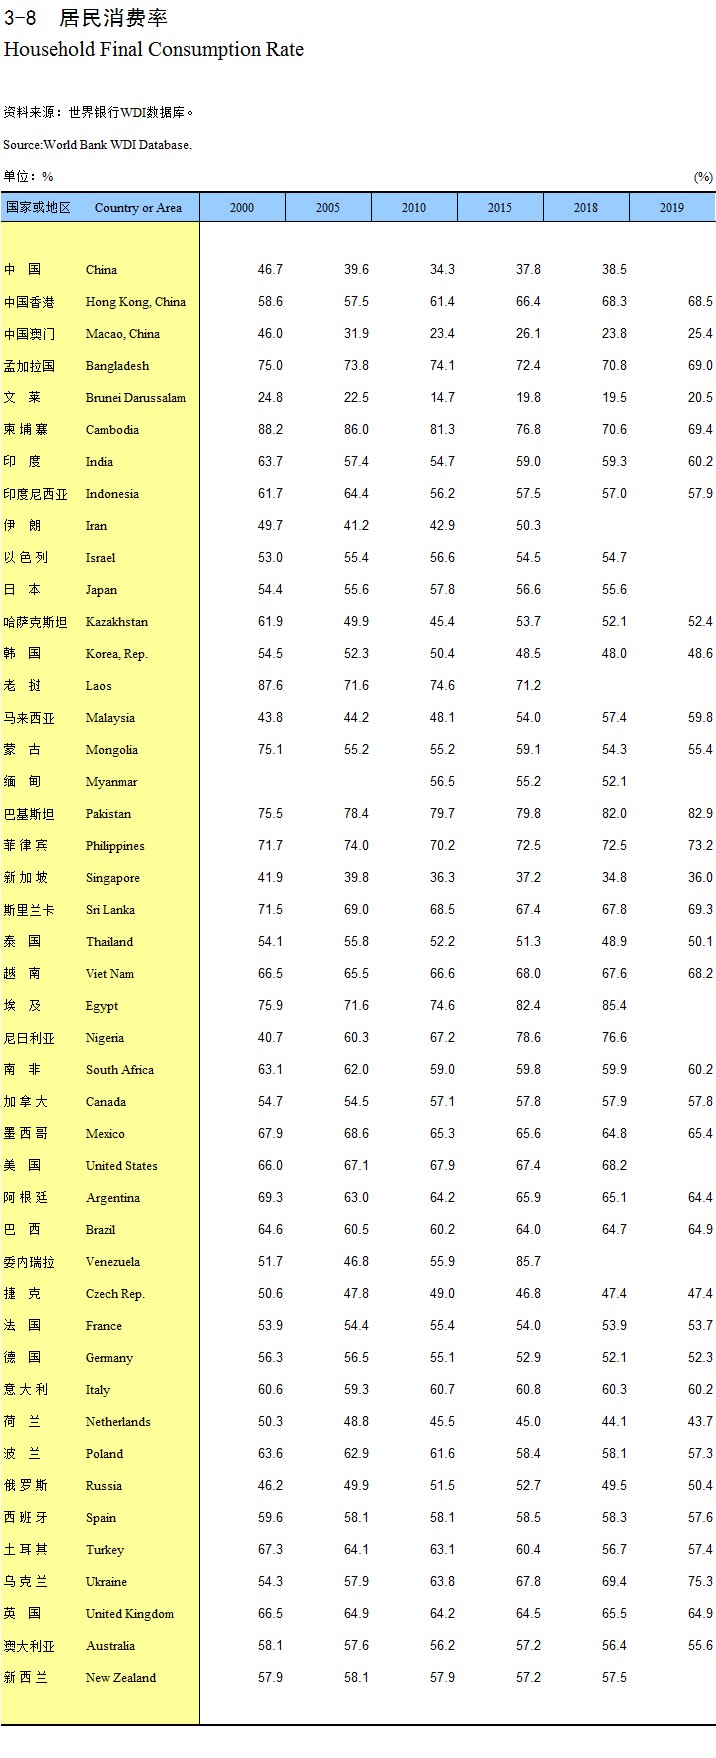
Household Final Consumption Rate
Composition of Gross Domestic Product by Industry
Gross Domestic Product by Production Approach
Gross Domestic Product by Expenditure Approach
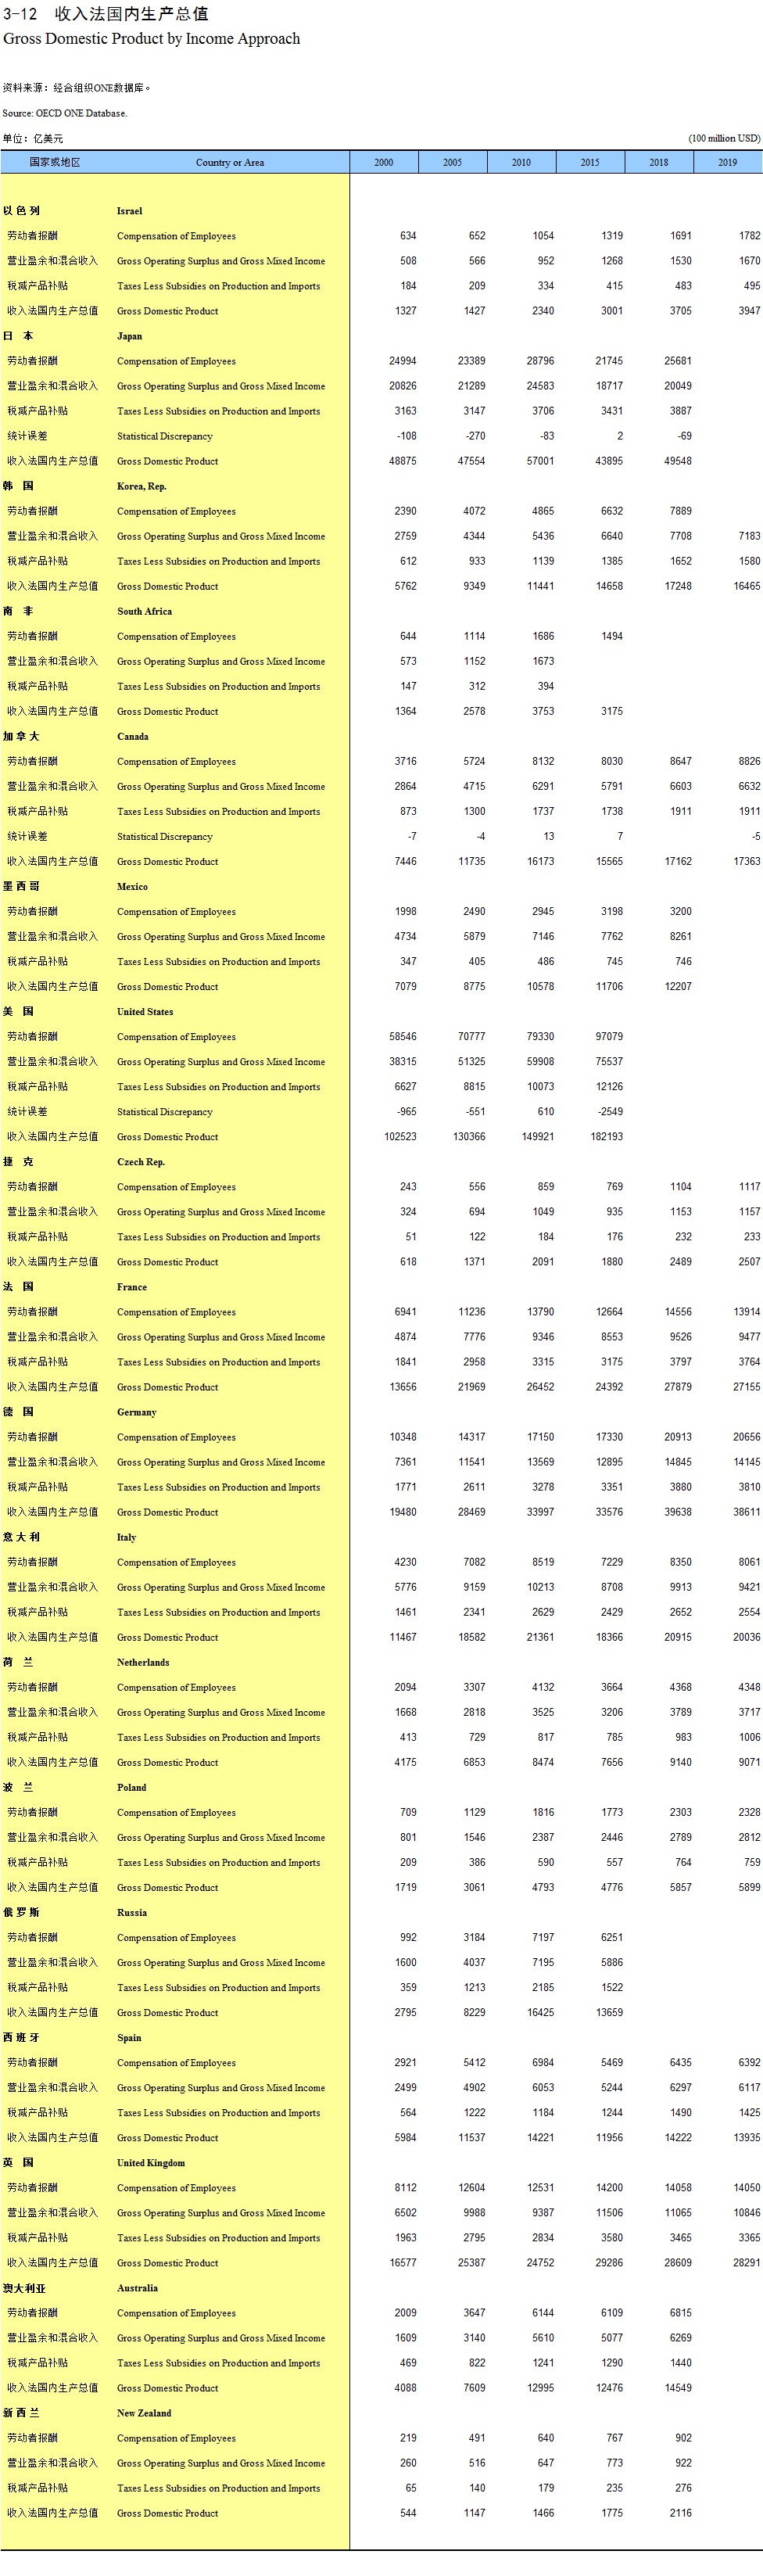
Gross Domestic Product by Income Approach
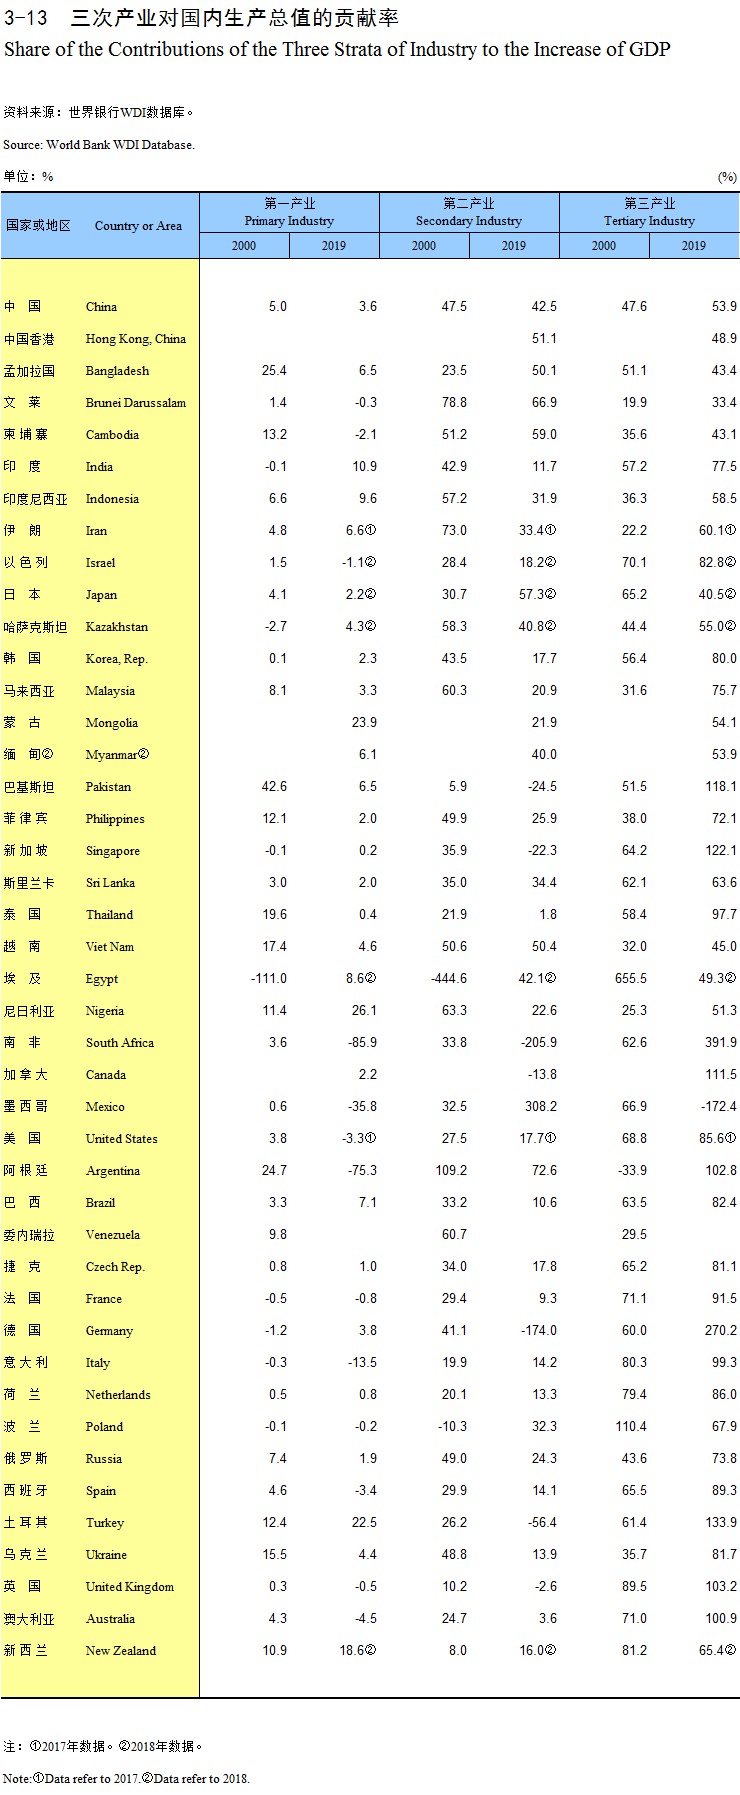
Share of the Contributions of the Three Strata of Industry to the Increase of GDP
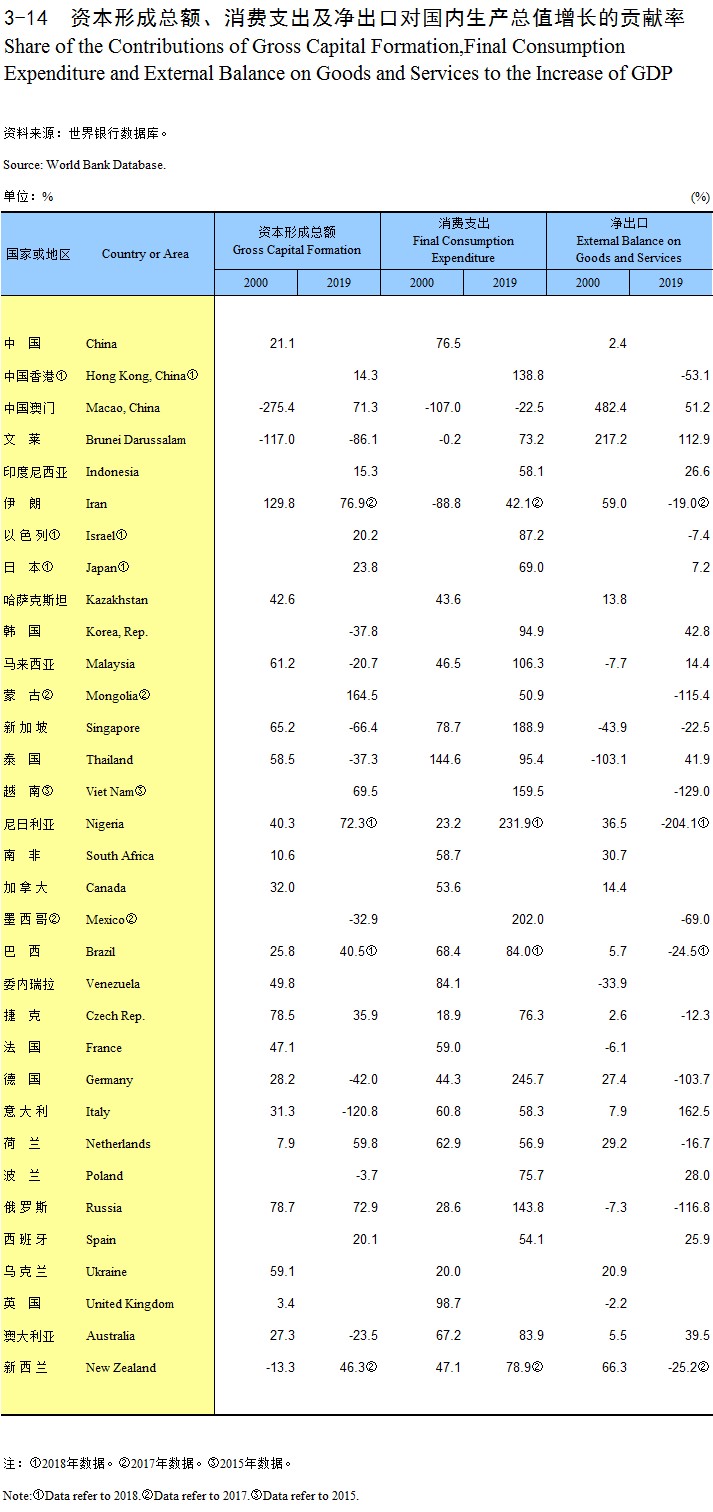
Share of the Contributions of Gross Capital Formation, Final Consumption Expenditure and External Balance on Goods and Services to the Increase of GDP
Explanatory Notes on Main Statistical Indicators
Population
Mid-year Population
Female Population as Percentage of Total
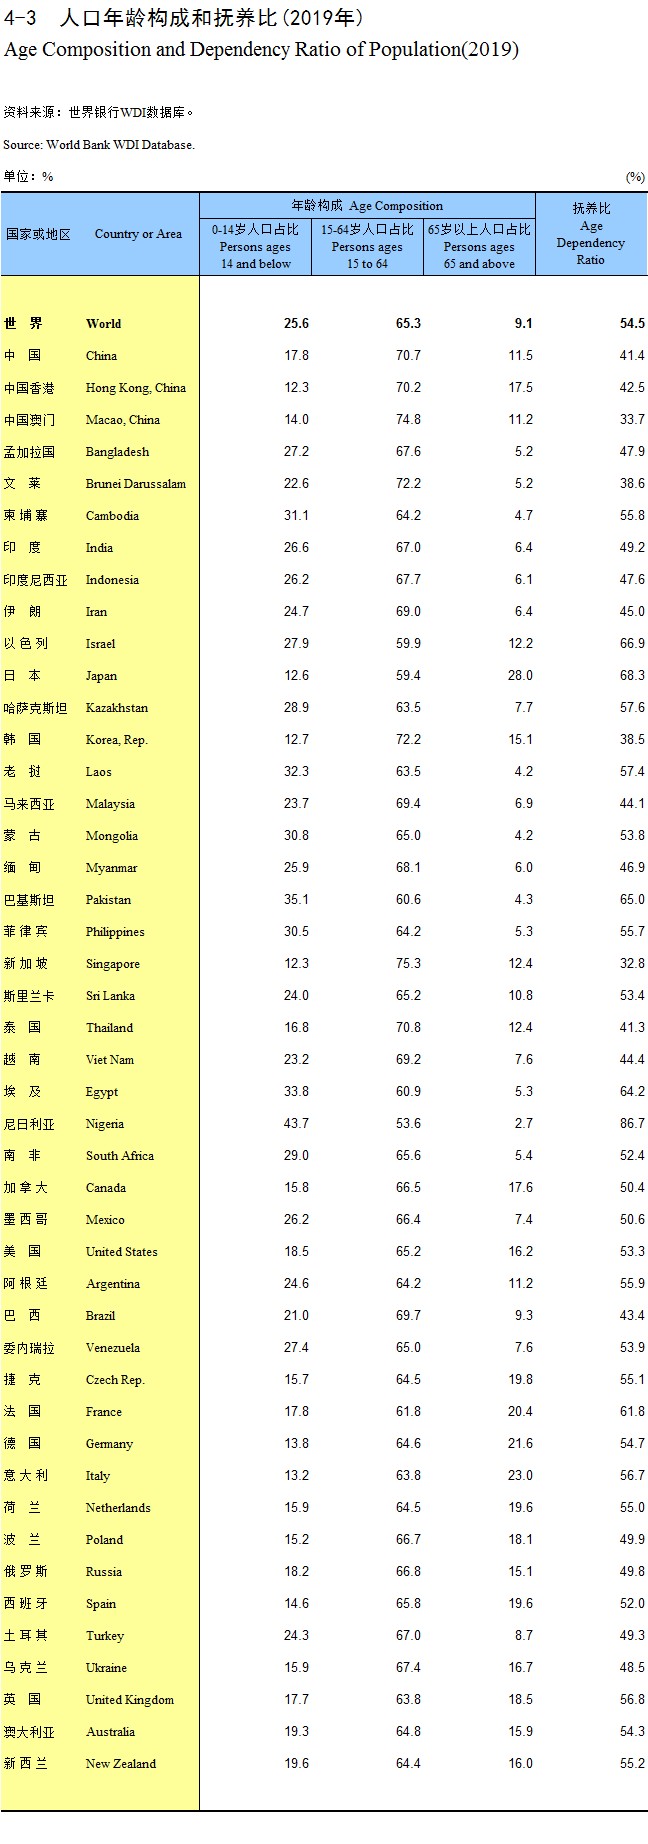
Age Composition and Dependency Ratio of Population (2019)
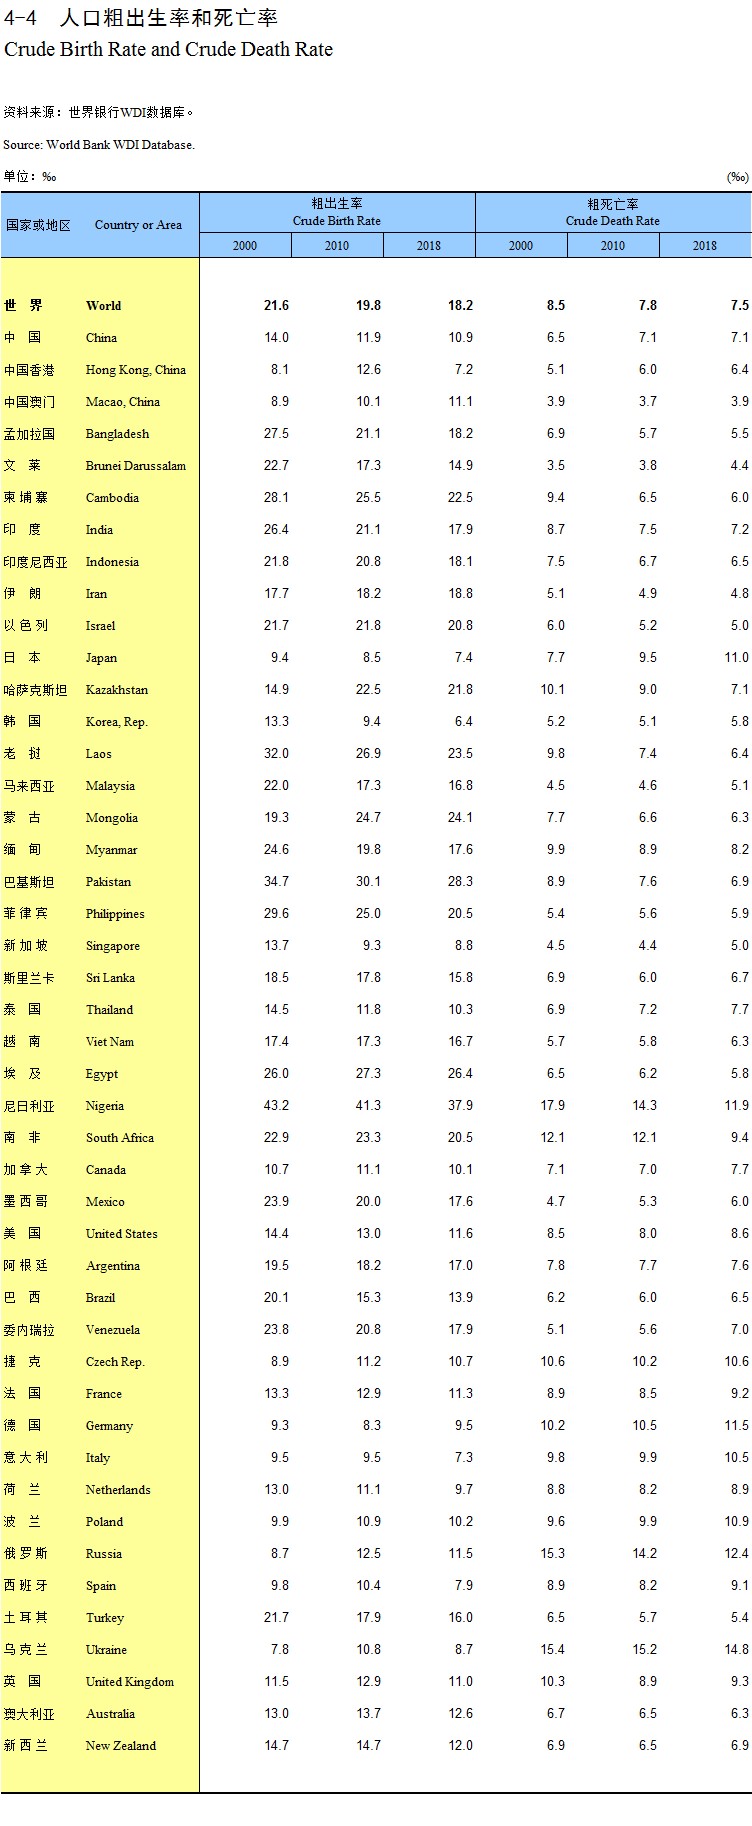
Crude Birth Rate and Crude Death Rate
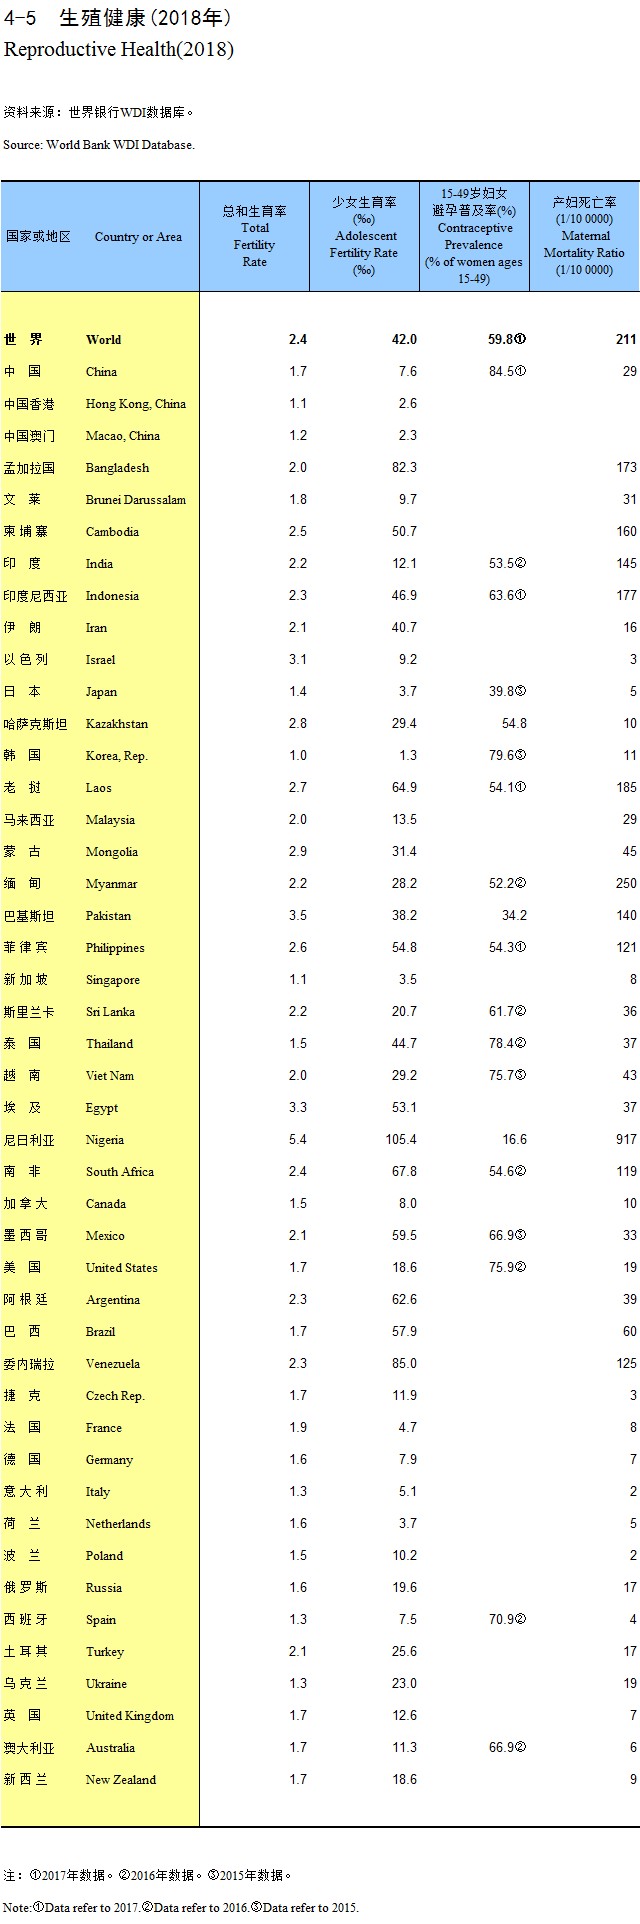
Reproductive Health (2018)
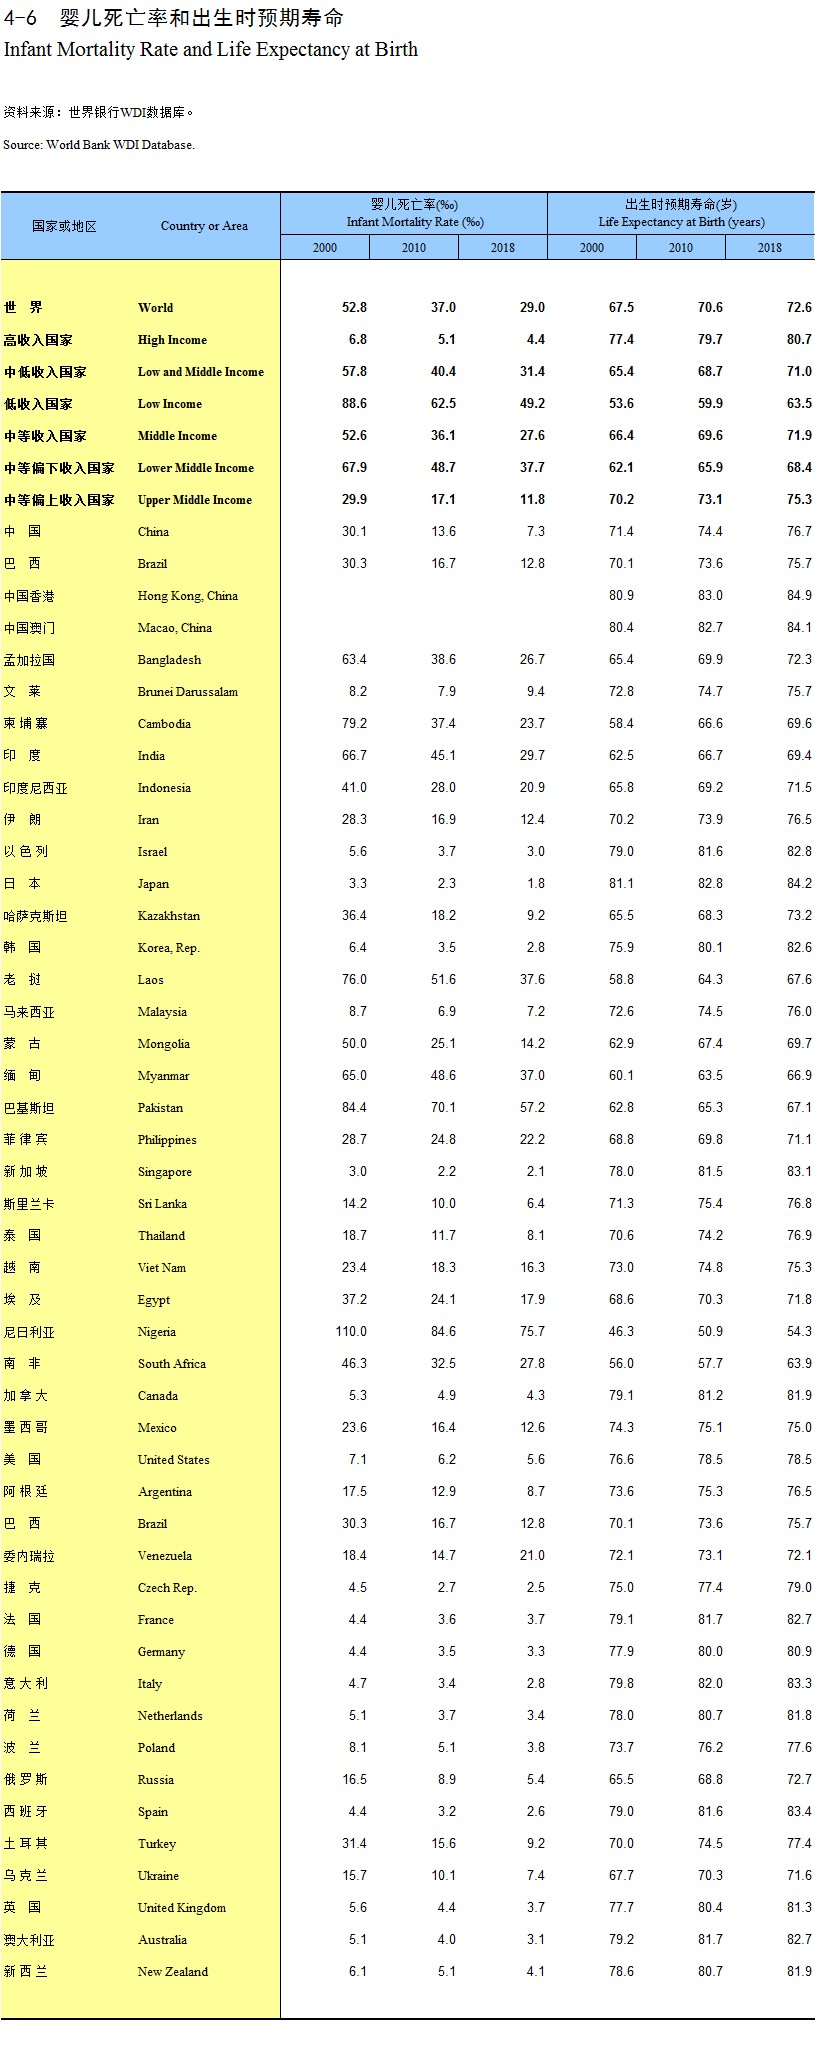
Infant Mortality Rate and Life Expectancy at Birth
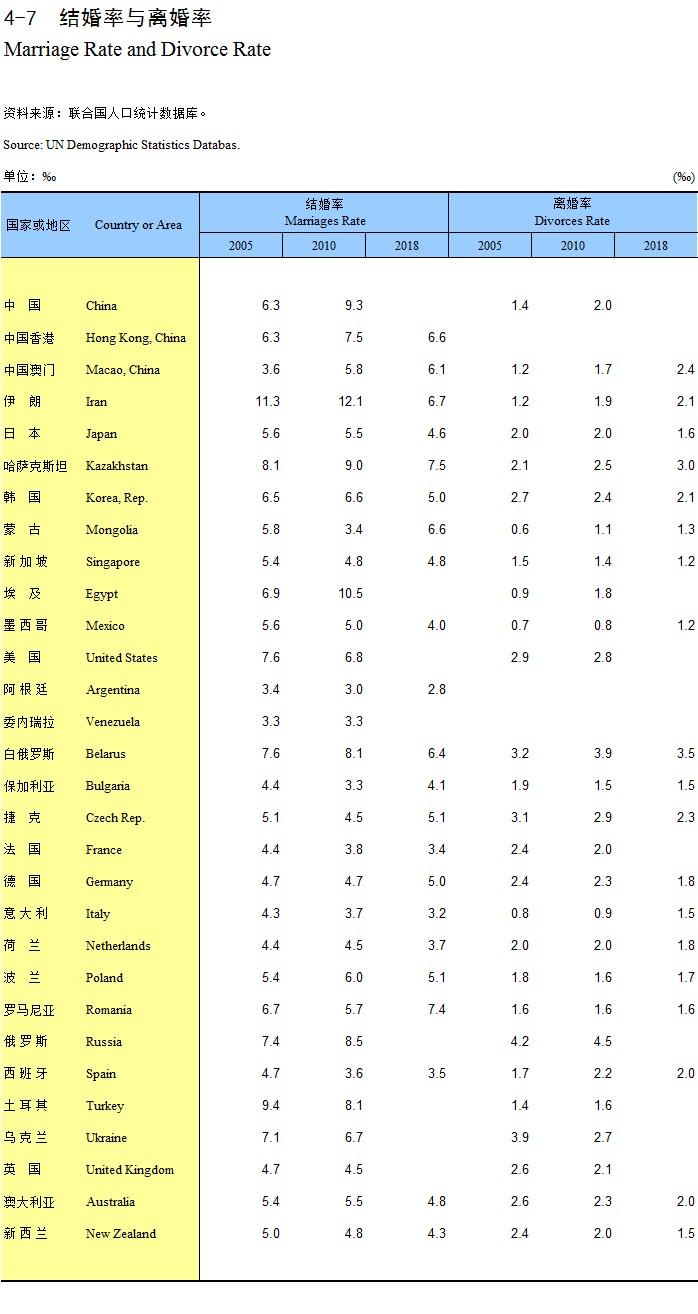
Marriage Rate and Divorce Rate
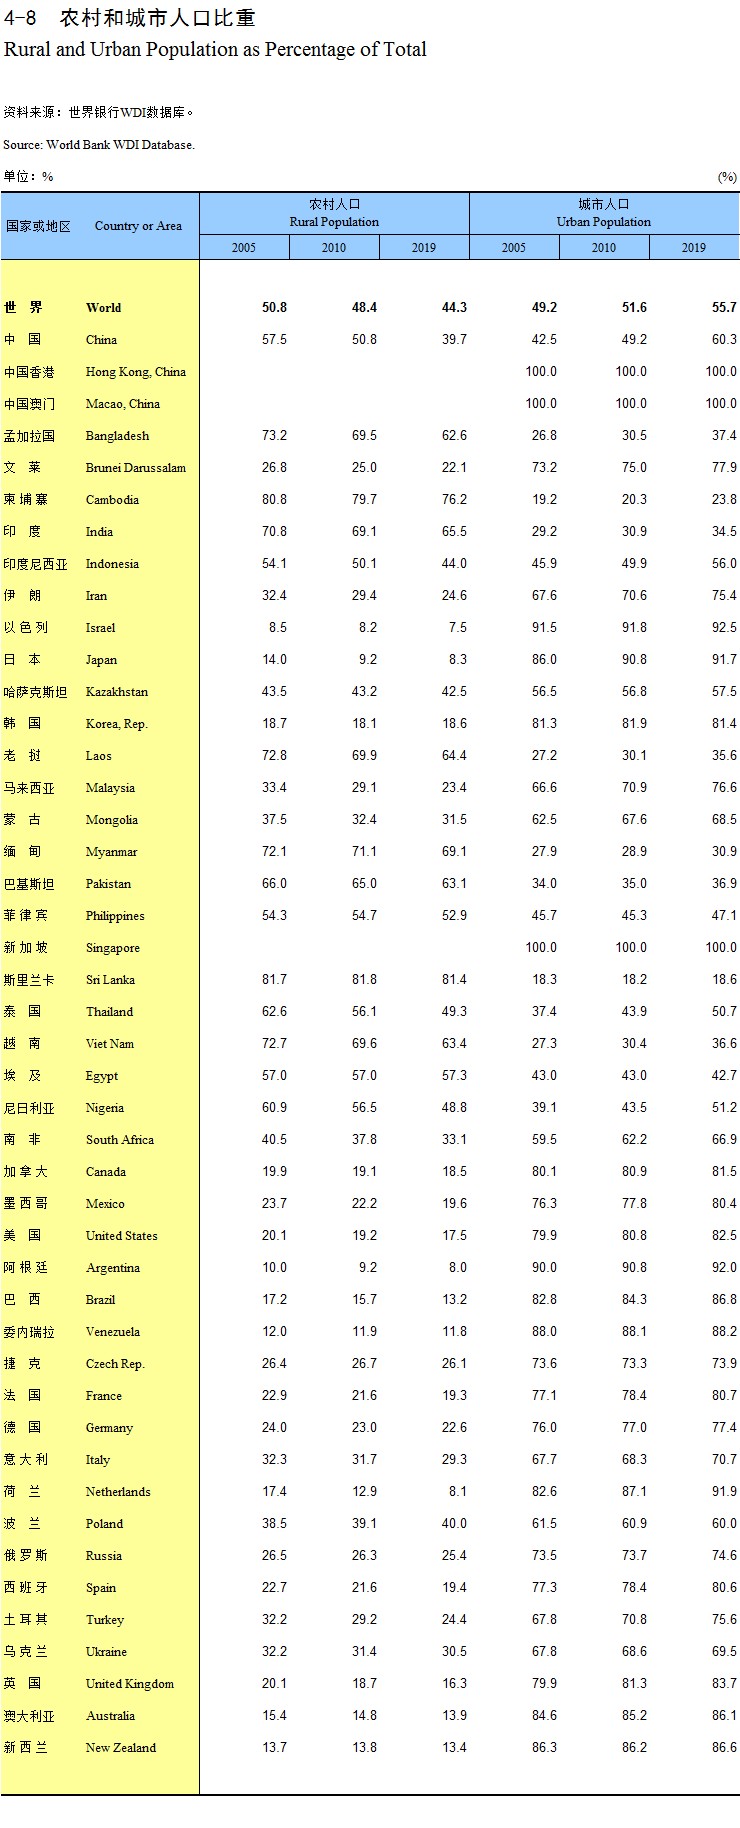
Rural and Urban Population as Percentage of Total
Explanatory Notes on Main Statistical Indicators
Employment and Earnings
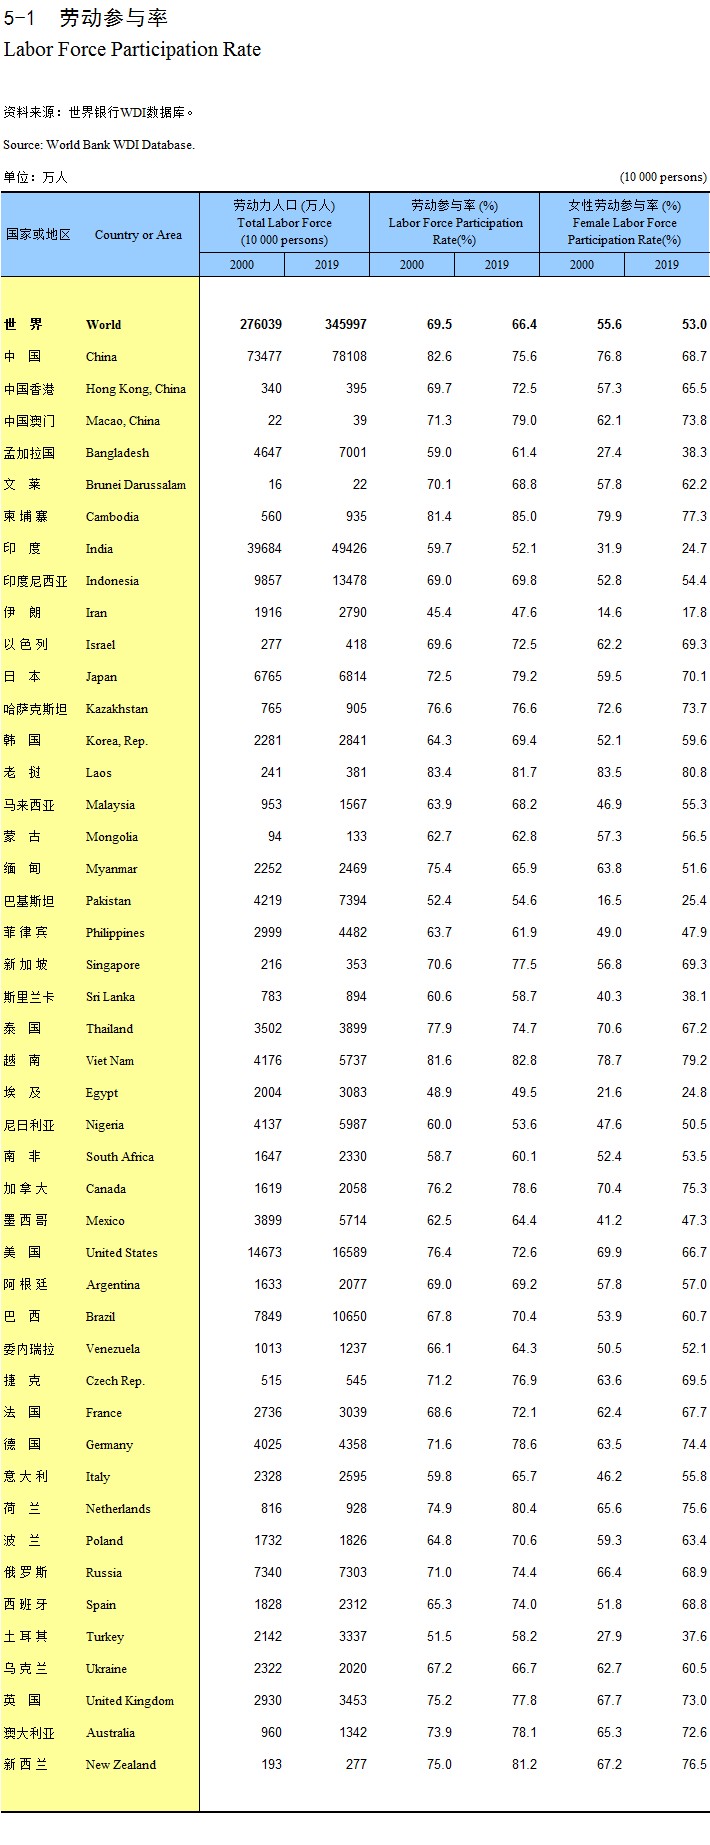
Labor Force Participation Rate
Employment
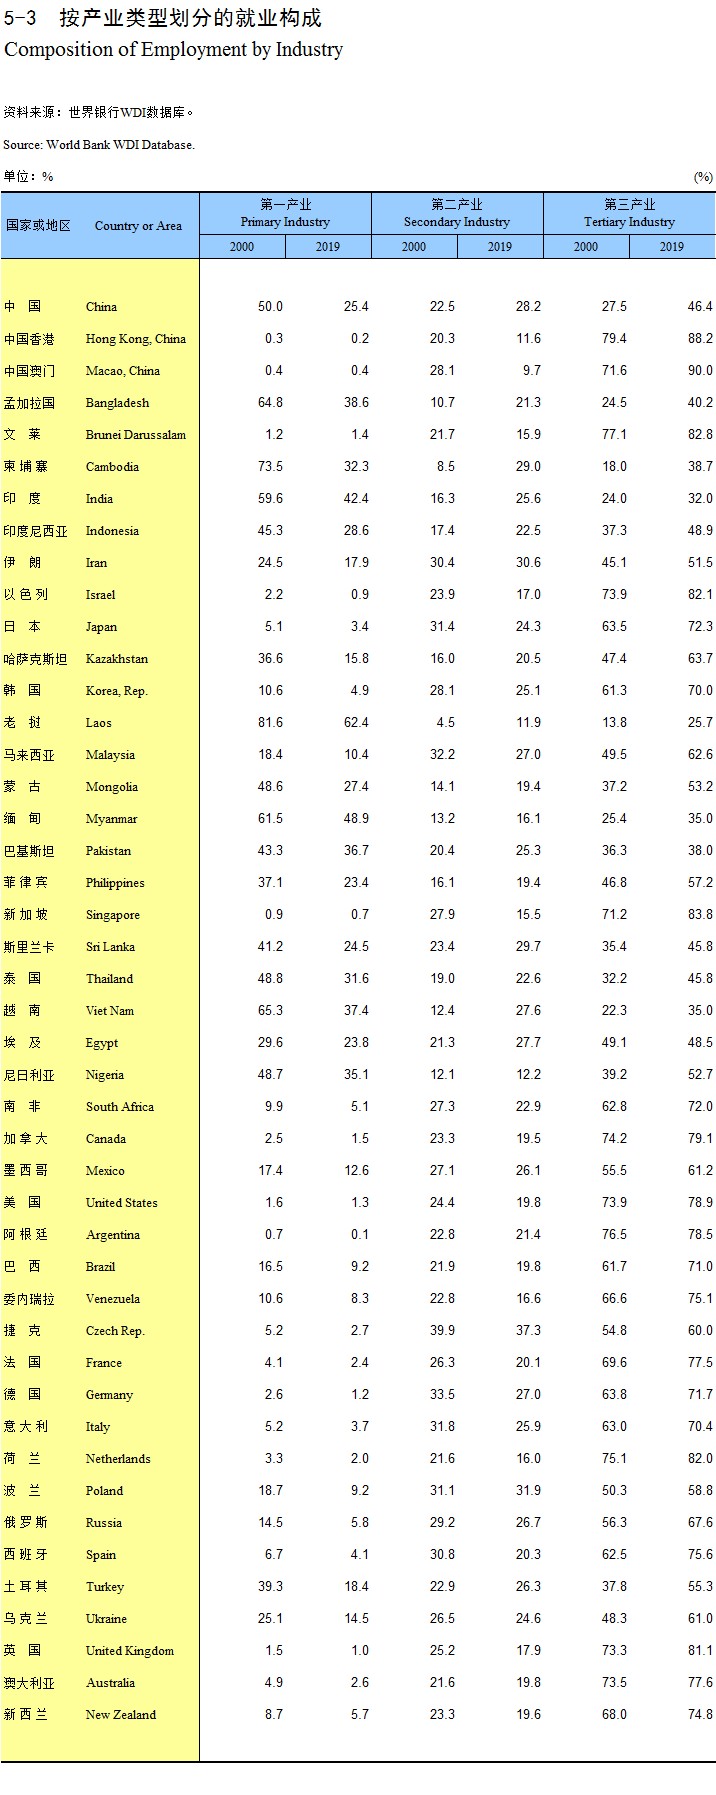
Composition of Employment by Industry
Employment by Economic Activity
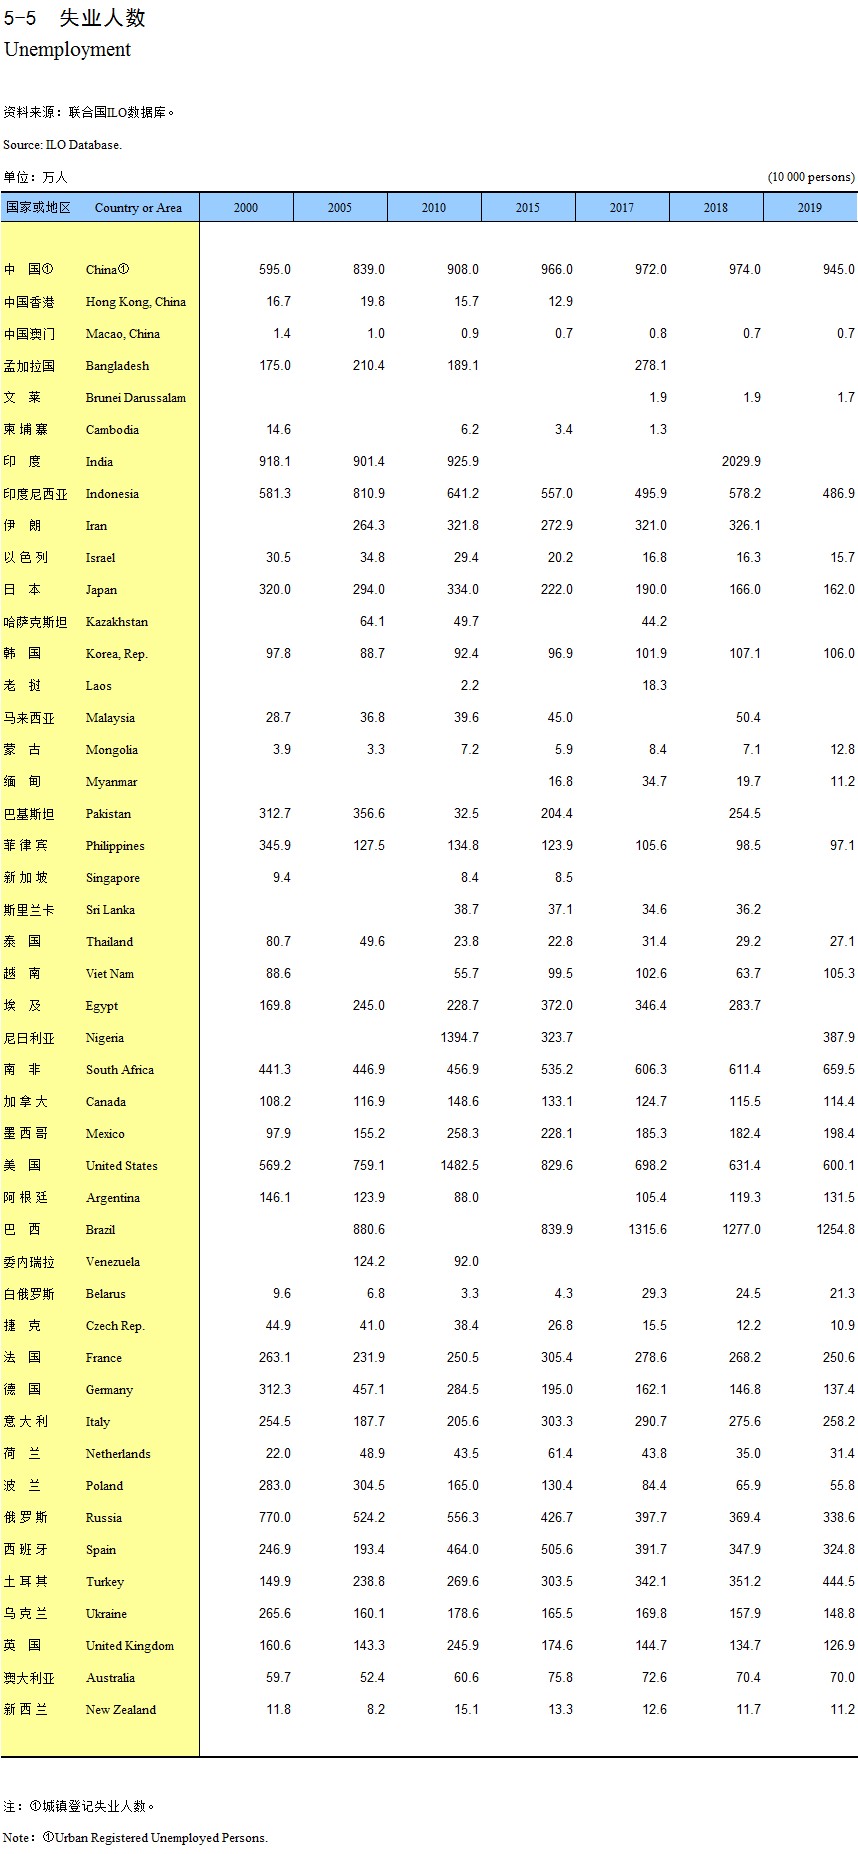
Unemployment
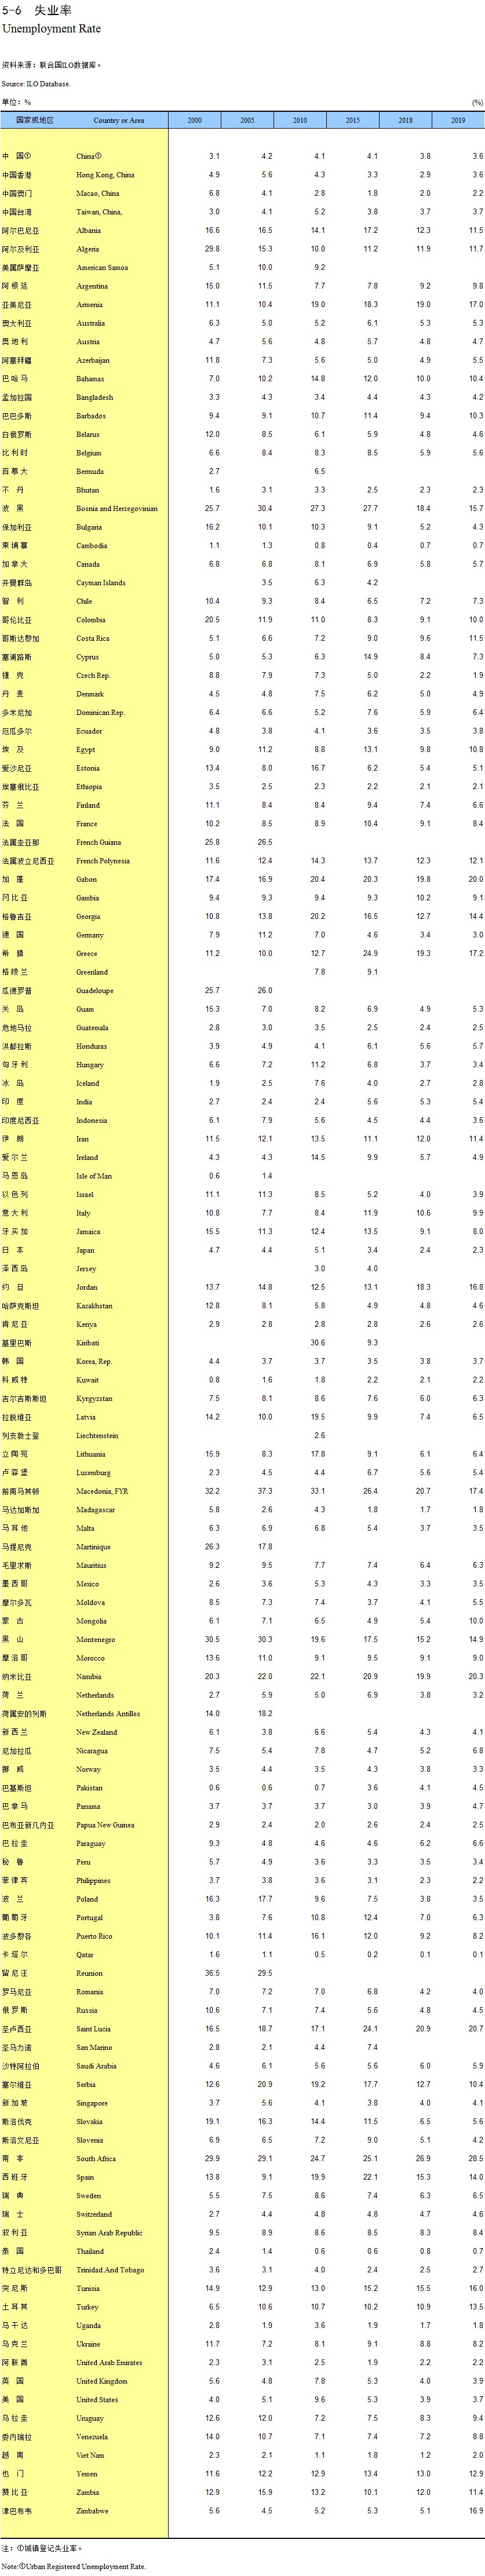
Unemployment Rate
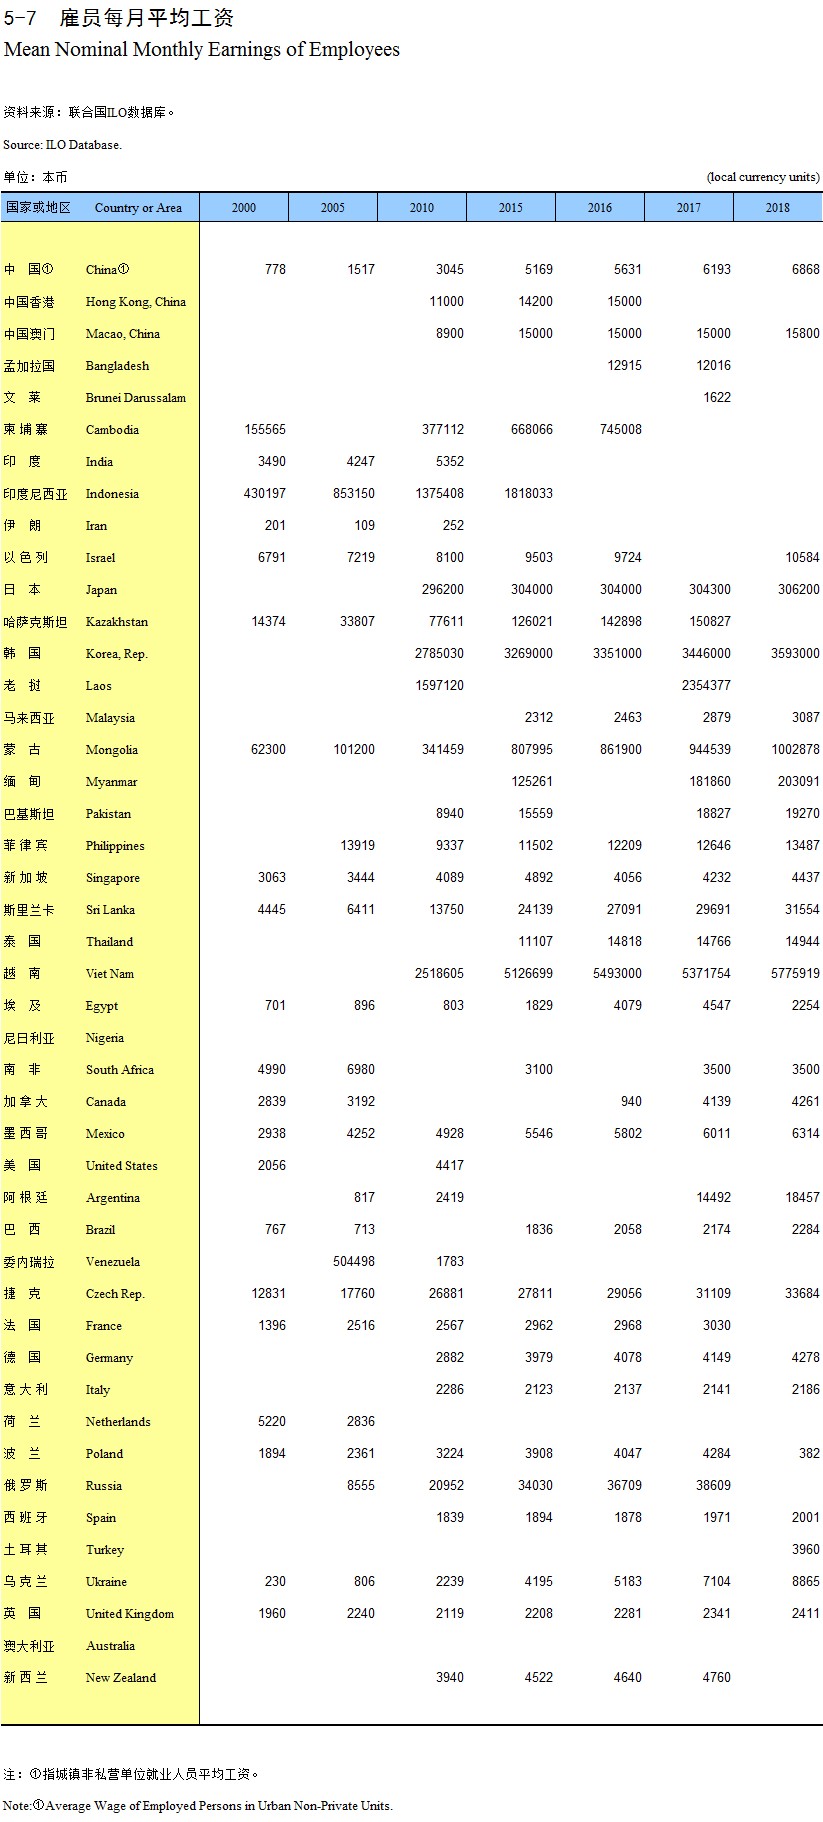
Mean Nominal Monthly Earnings of Employees
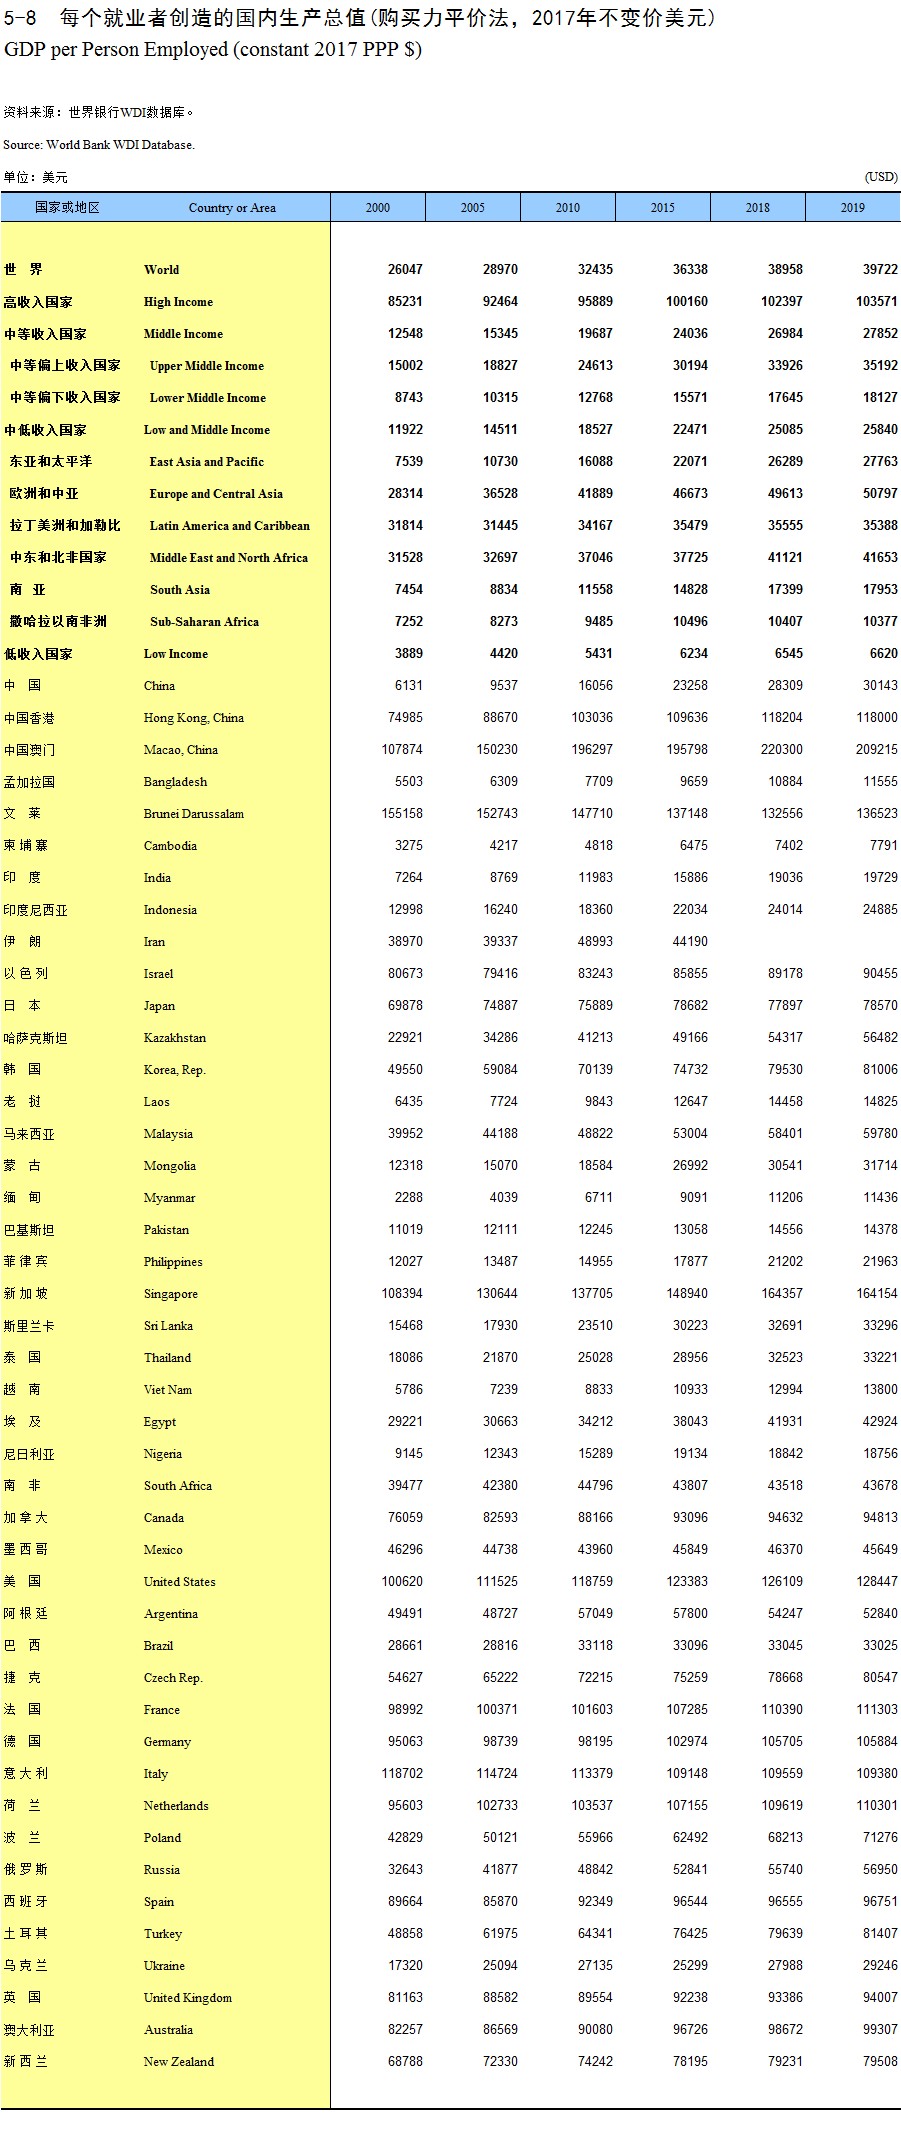
GDP per Person Employed (constant 2017 PPP $)
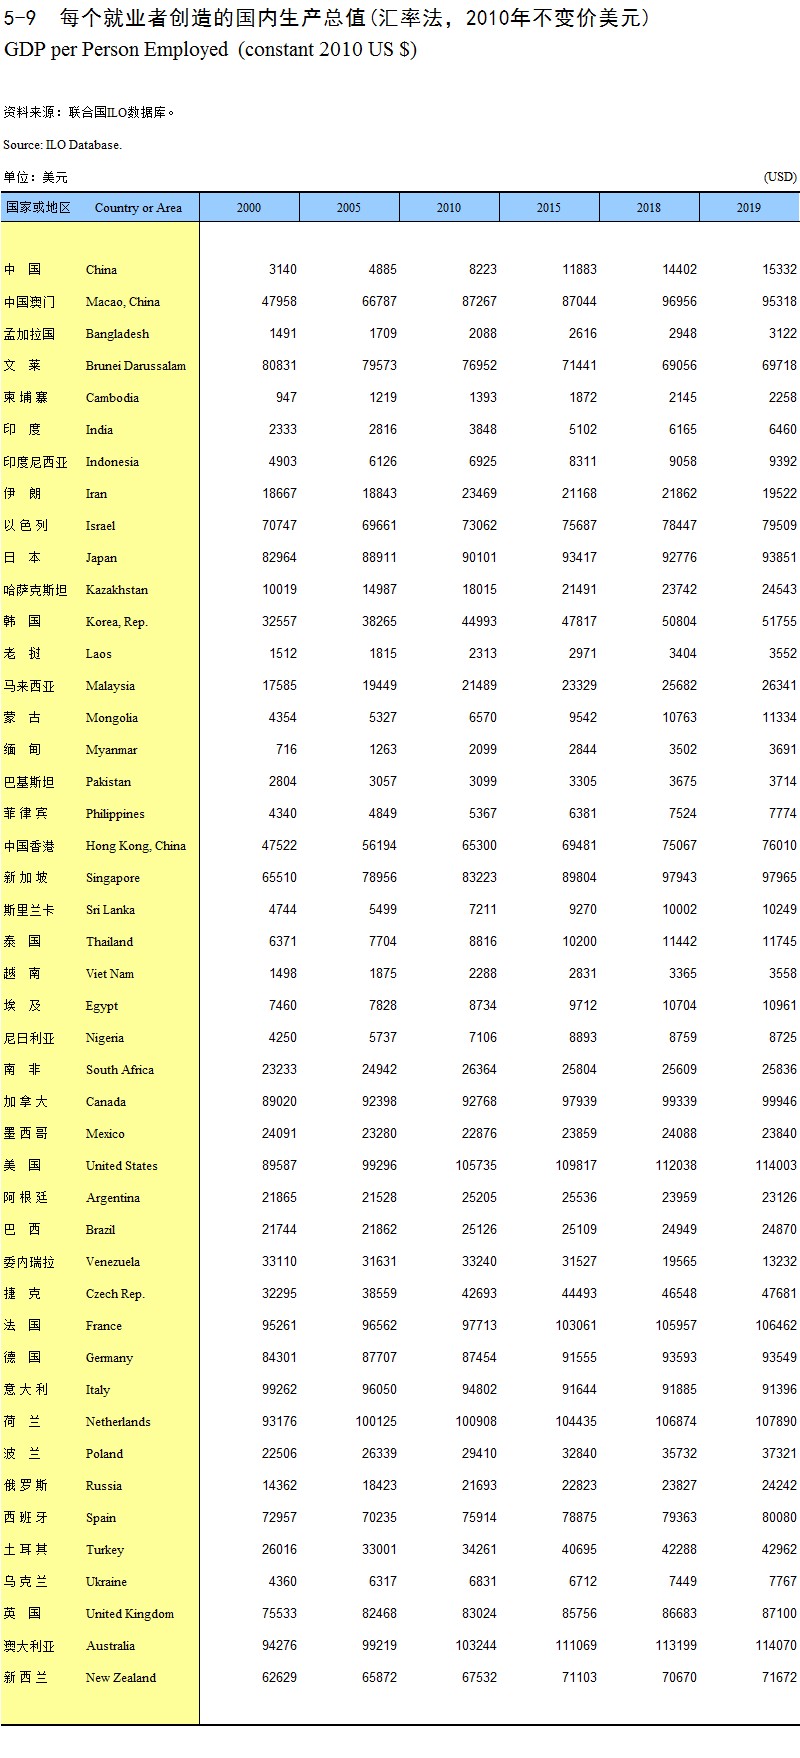
GDP per Person Employed (constant 2010 US $)
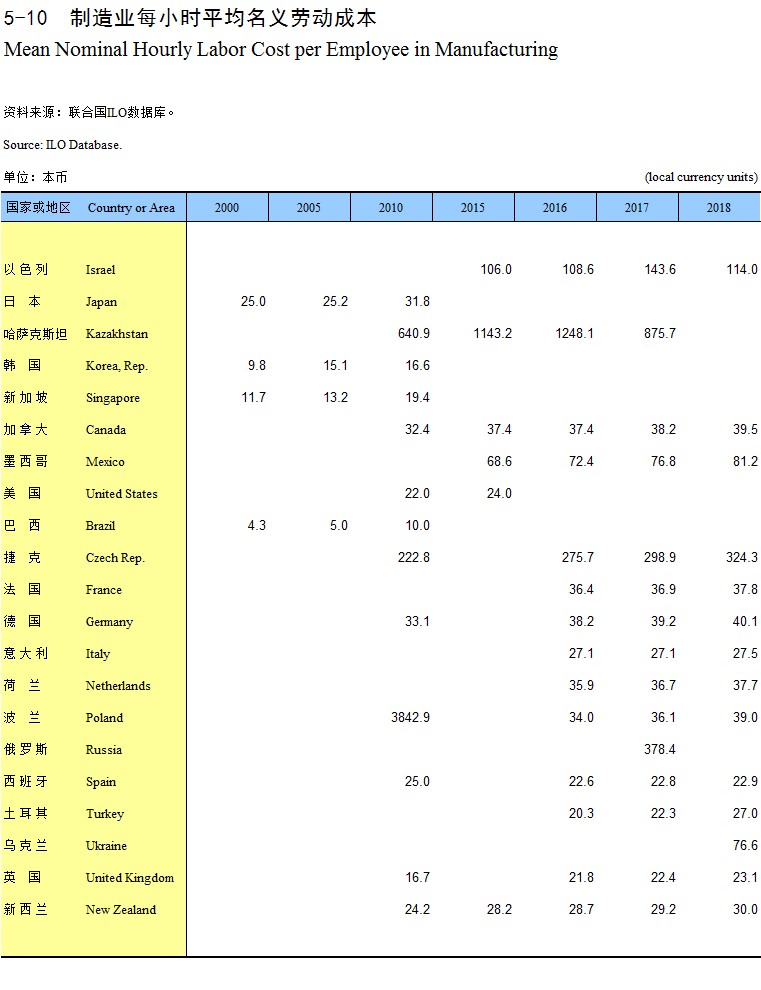
Mean Nominal Hourly Labor Cost per Employee in Manufacturing
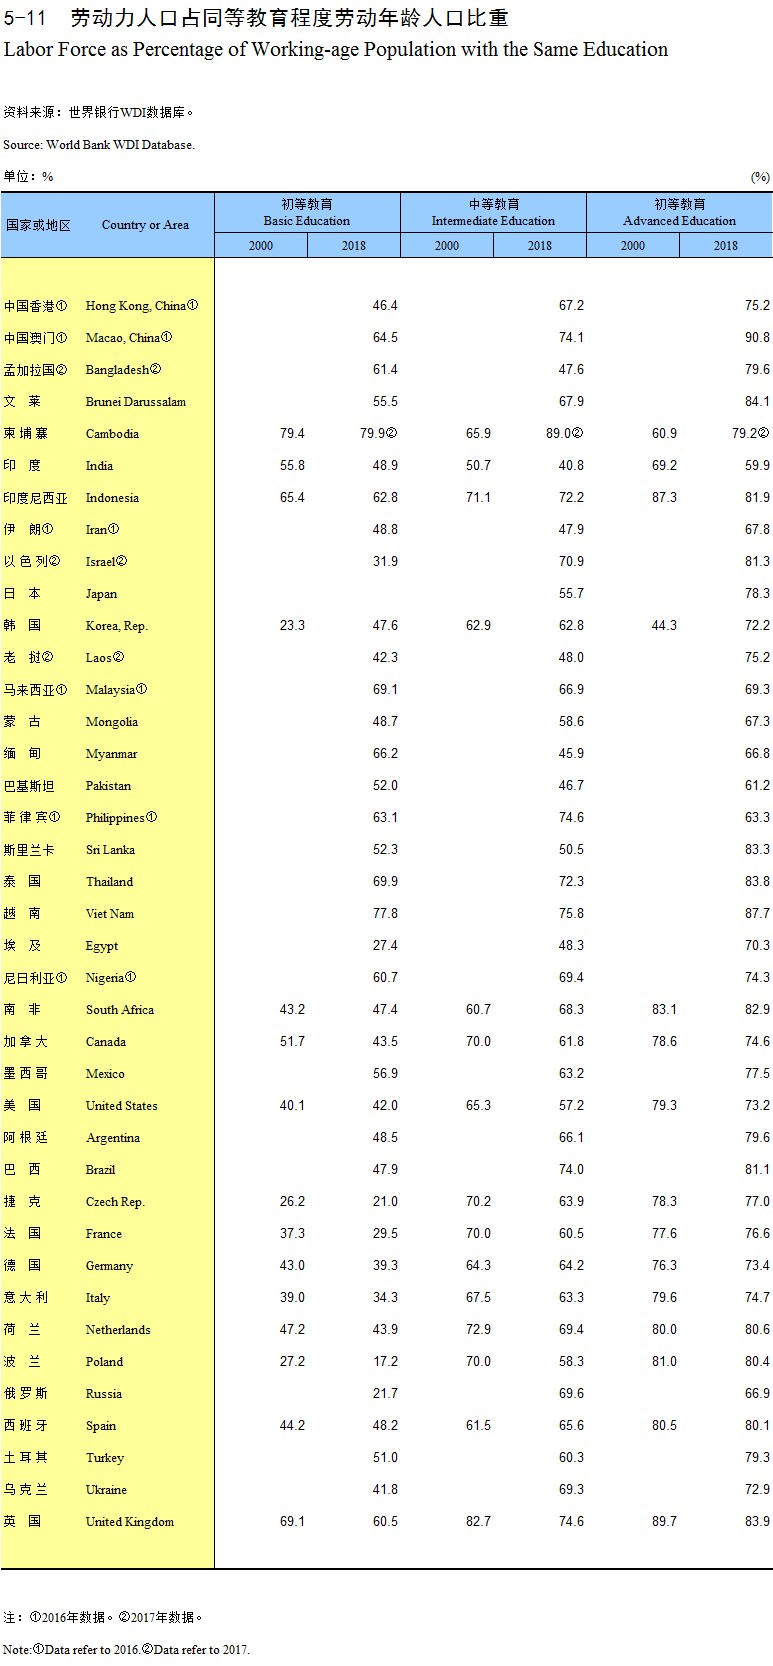
Labor Force as Percentage of Working-age Population with the Same Education
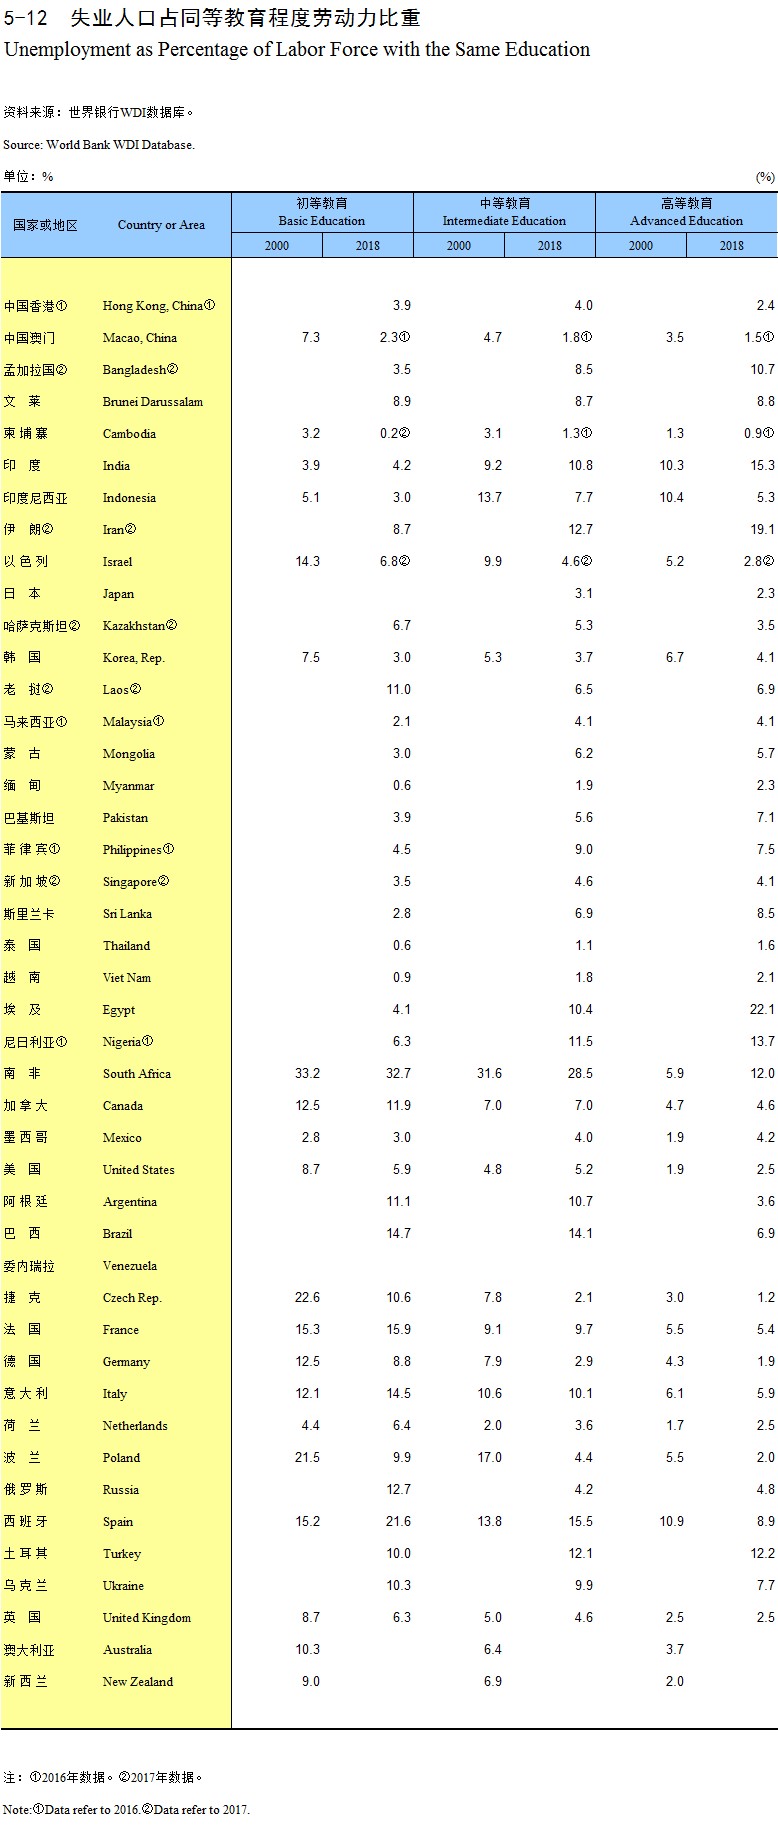
Unemployment as Percentage of Labor Force with the Same Education
Explanatory Notes on Main Statistical Indicators
Investment Environment
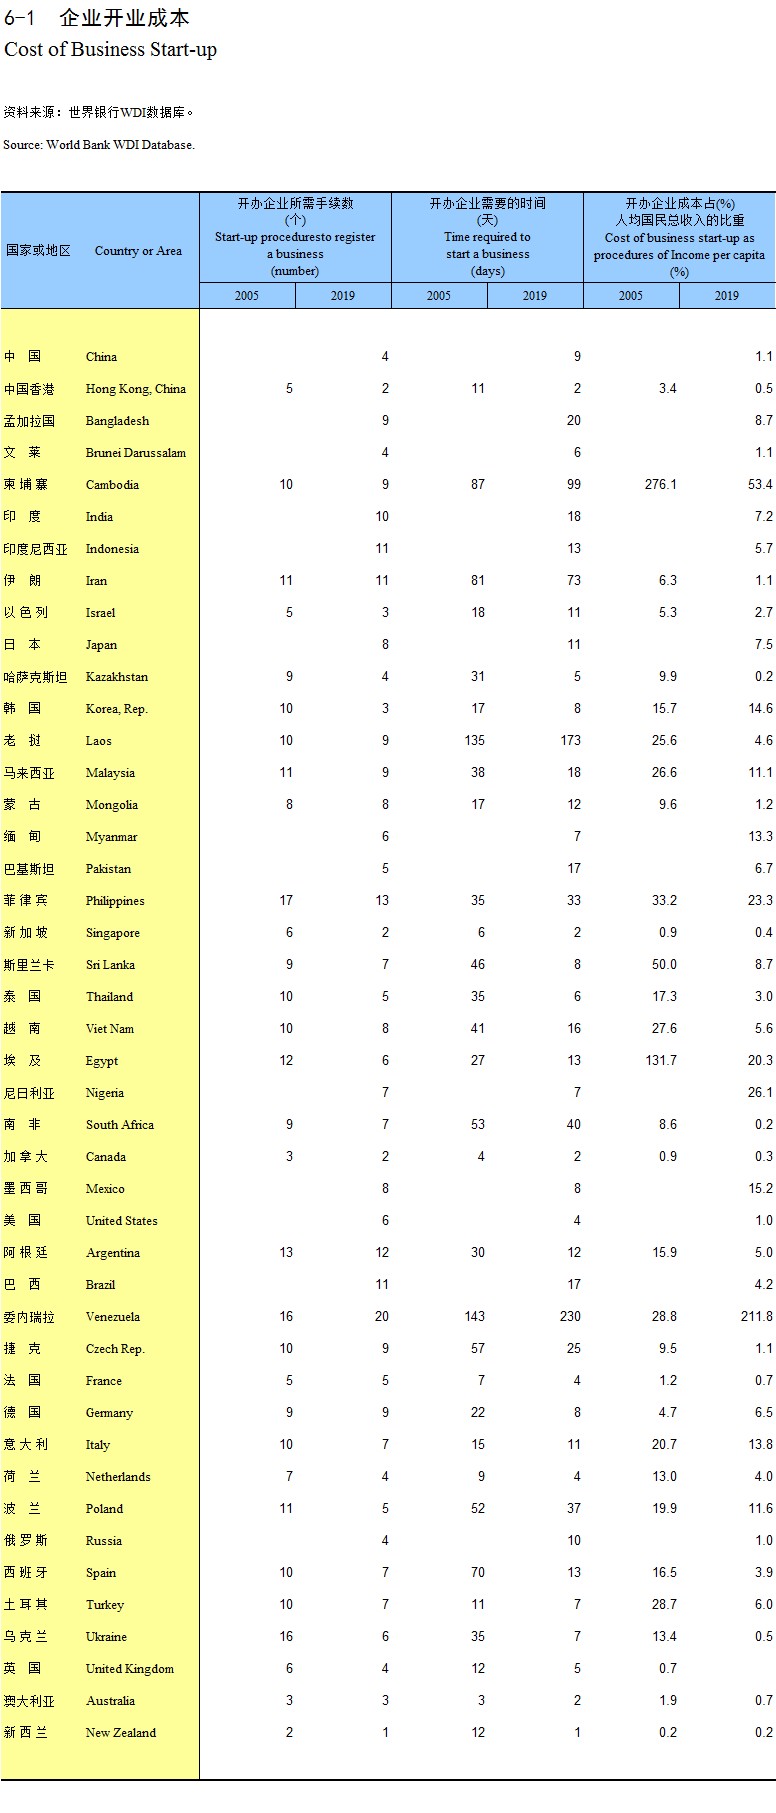
Cost of Business Start-up
Ease of Doing Businesses Rank (2019)
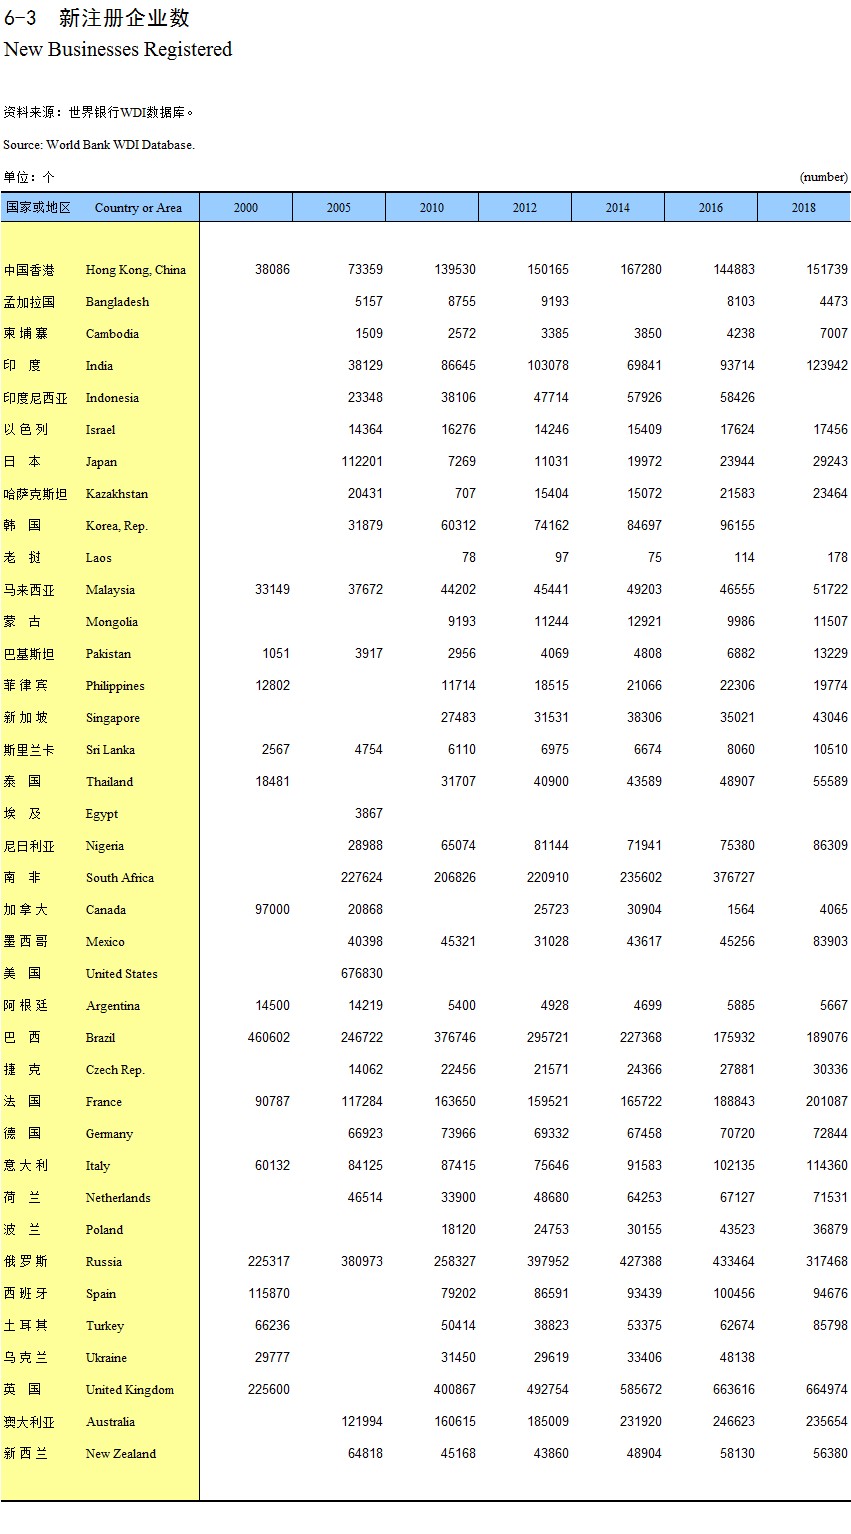
New Businesses Registered
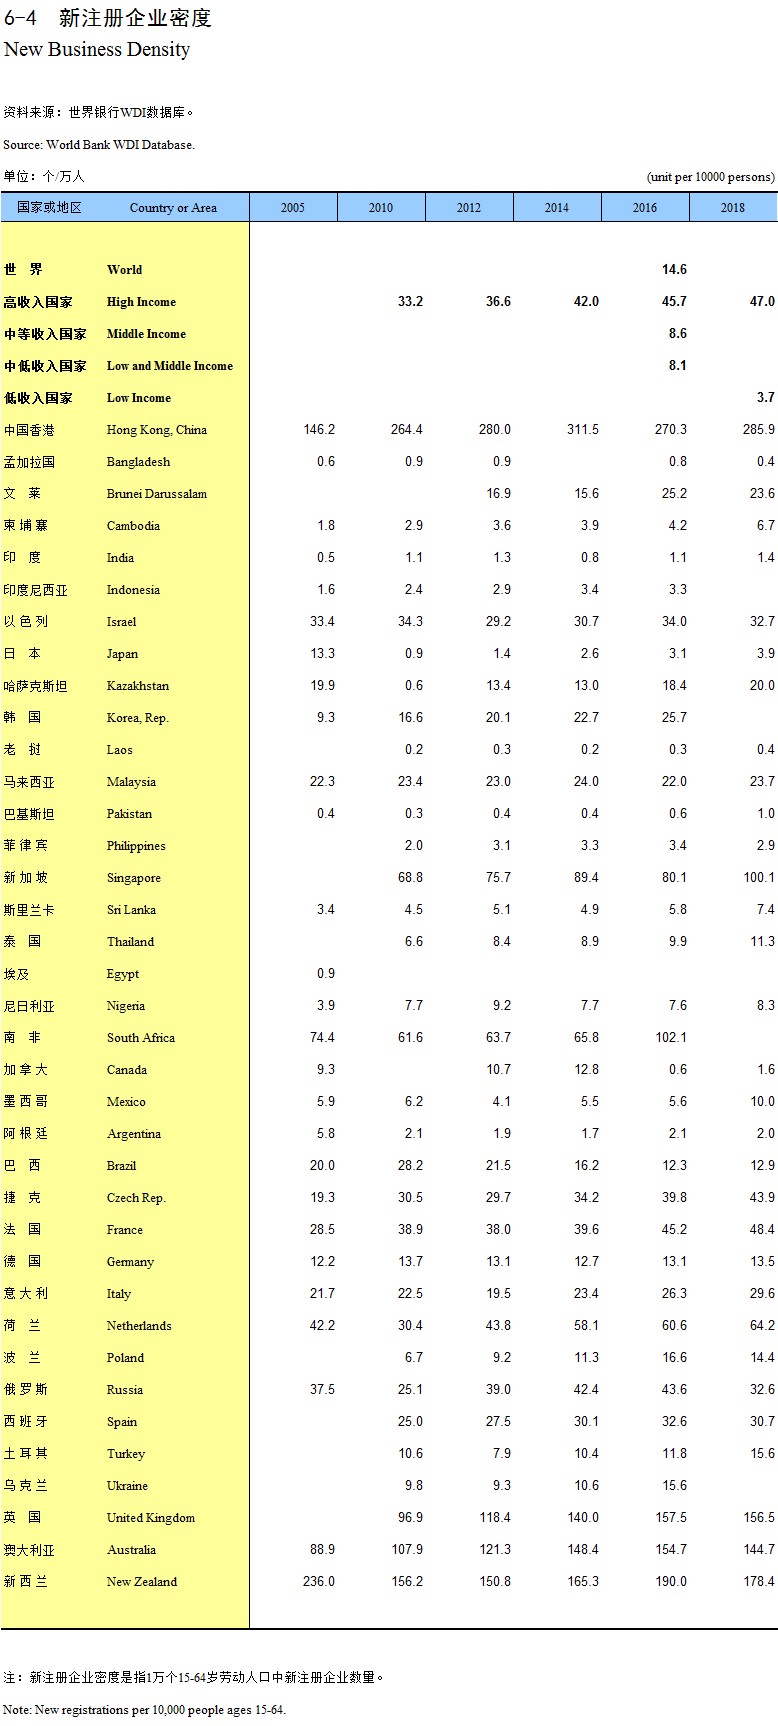
New Business Density
Domestic Credit to Private Sector as Percentage of GDP
Explanatory Notes on Main Statistical Indicators
Energy
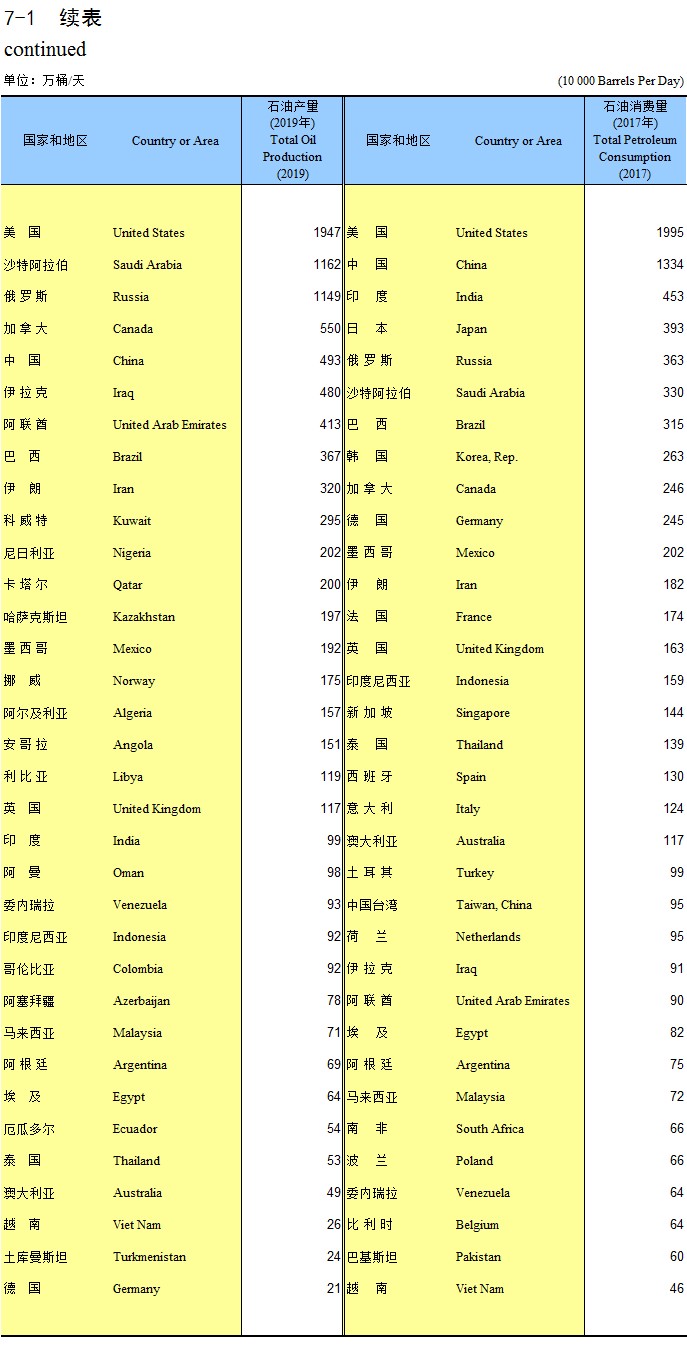
Main Oil Indicators
continued
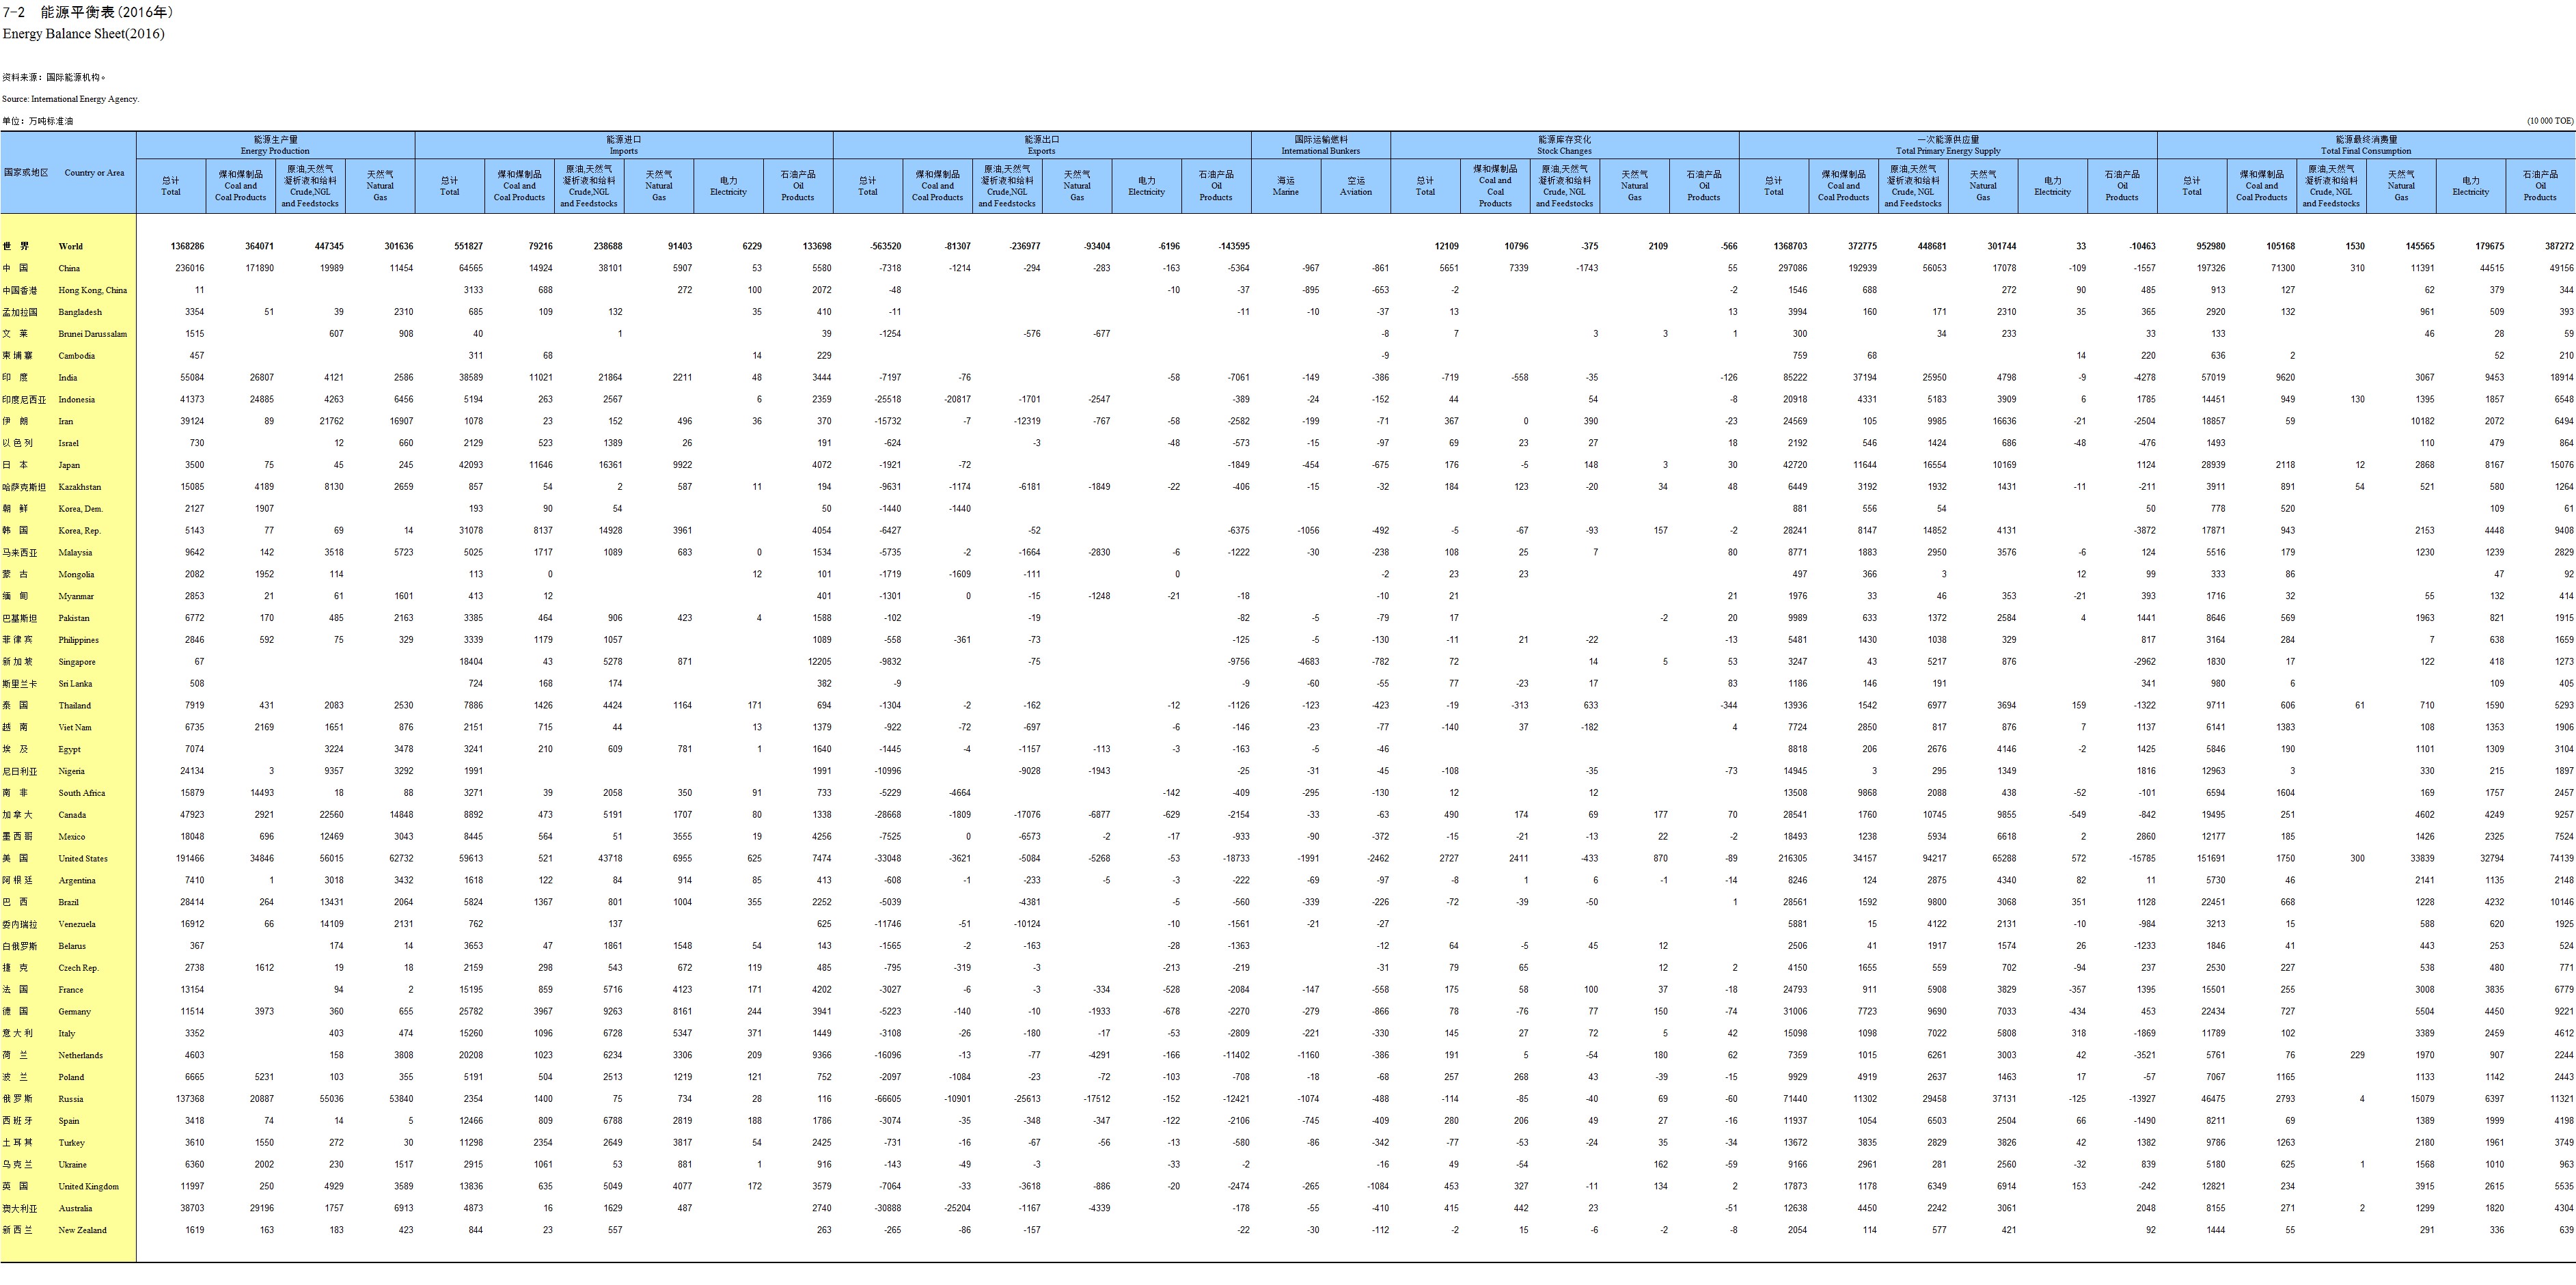
Energy Balance Sheet (2016)
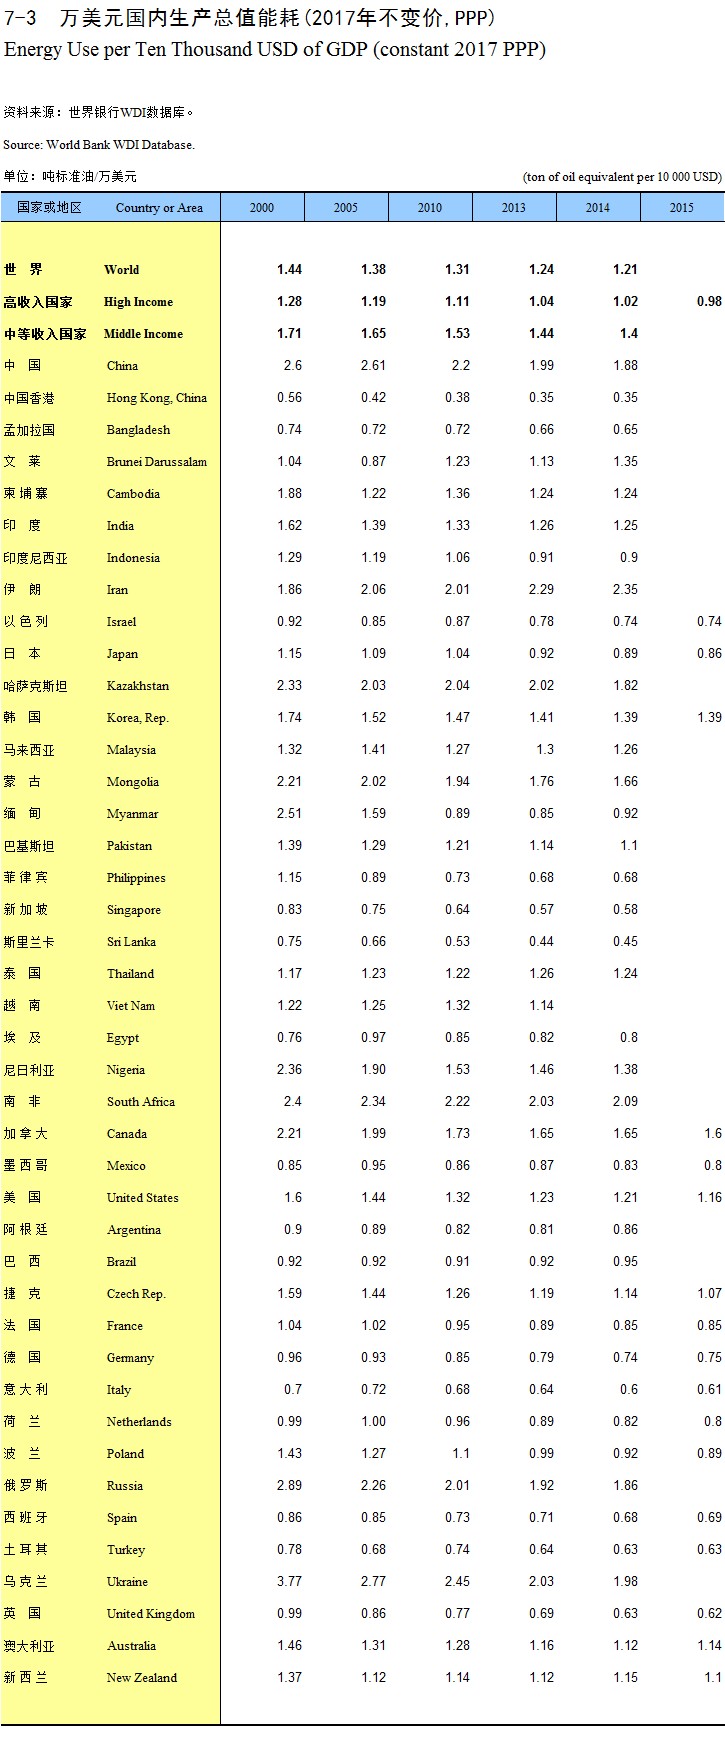
Energy Use per Ten Thousand USD of GDP (constant 2017 PPP)
Net Installed Capacity of Electricity Generating Plants (2017)
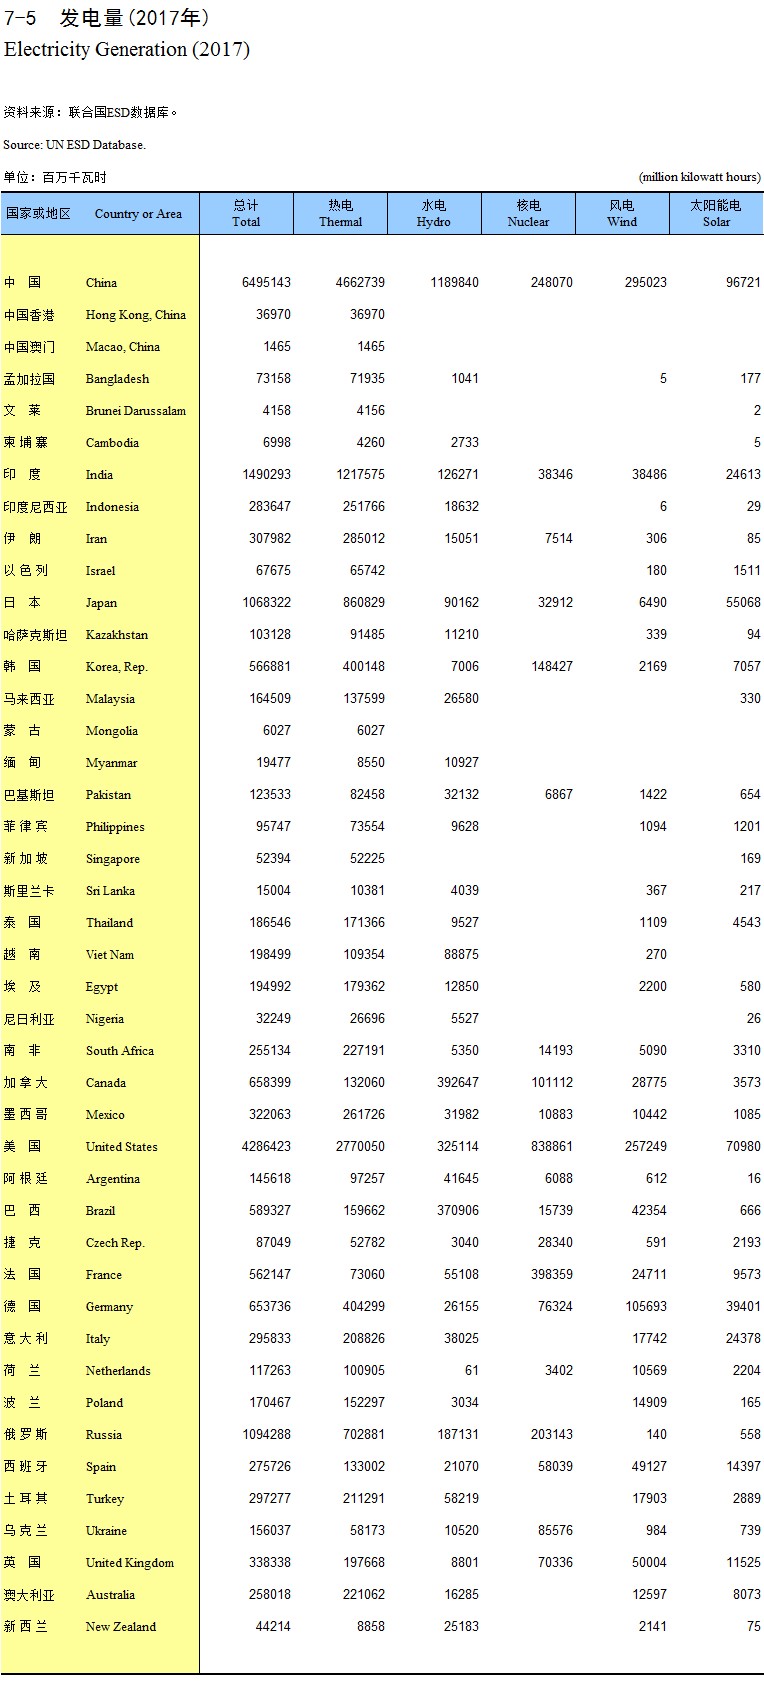
Electricity Generation (2017)
Net Energy Imports as Percentage of Energy Use
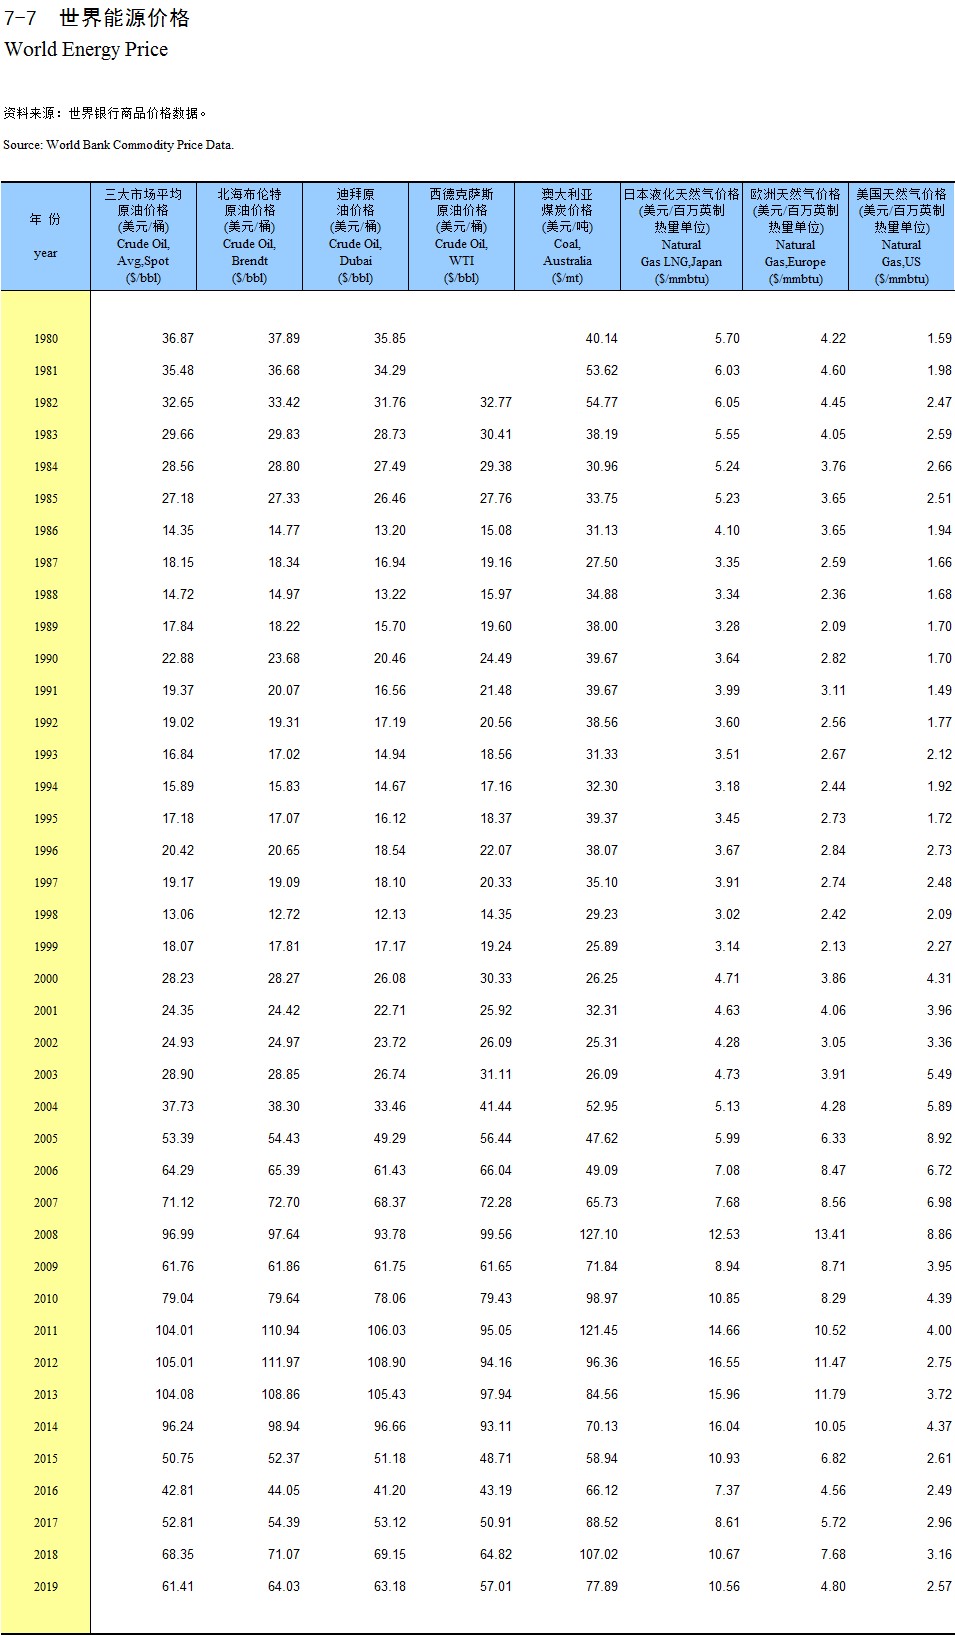
World Energy Price
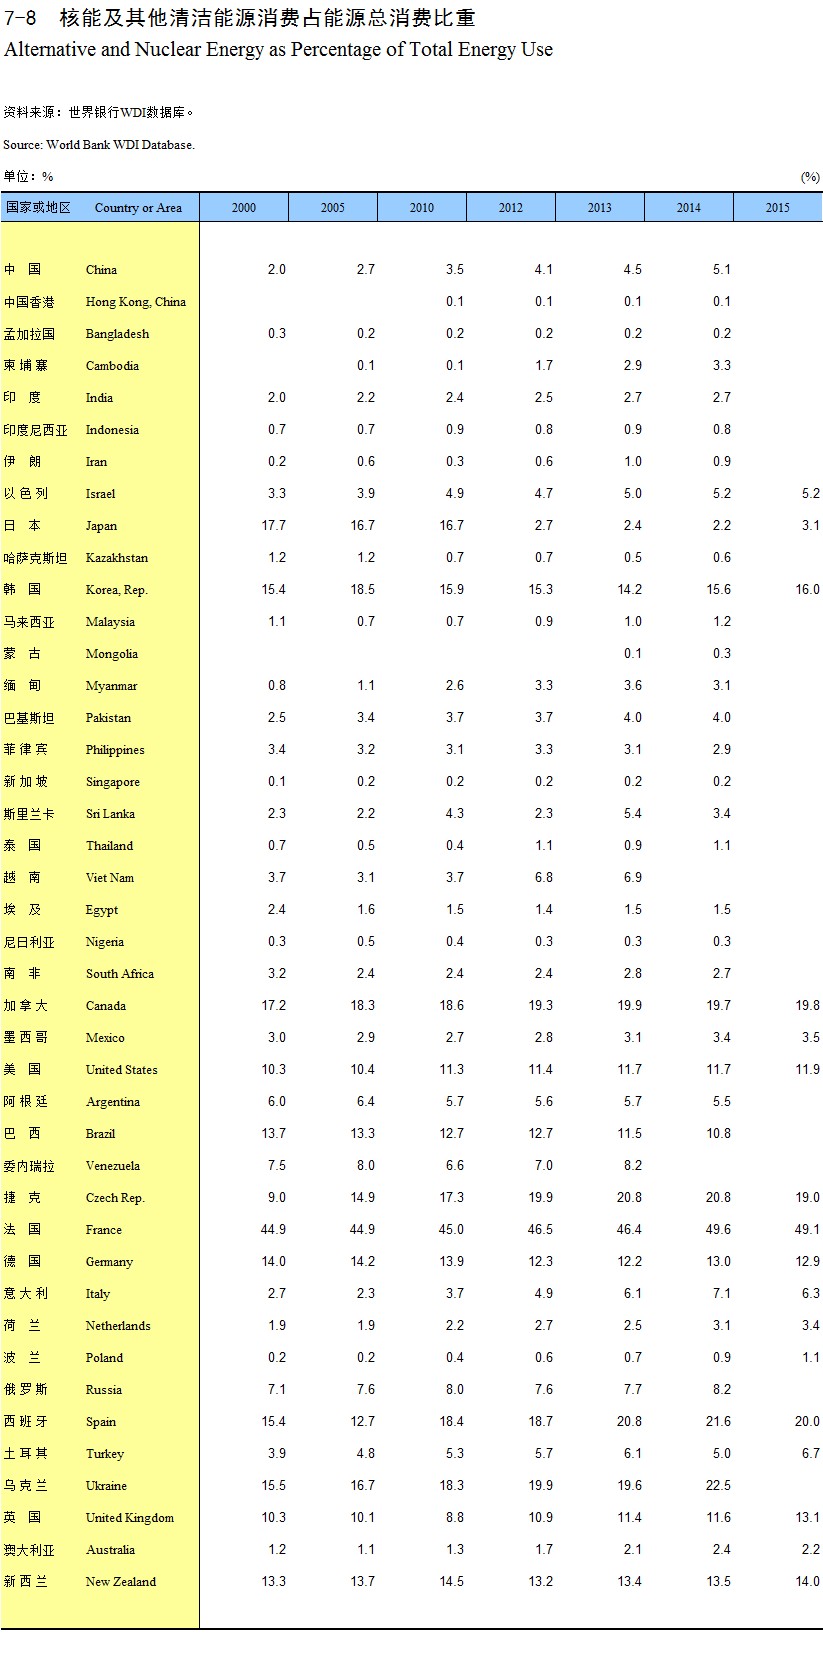
Alternative and Nuclear Energy as Percentage of Total Energy Use
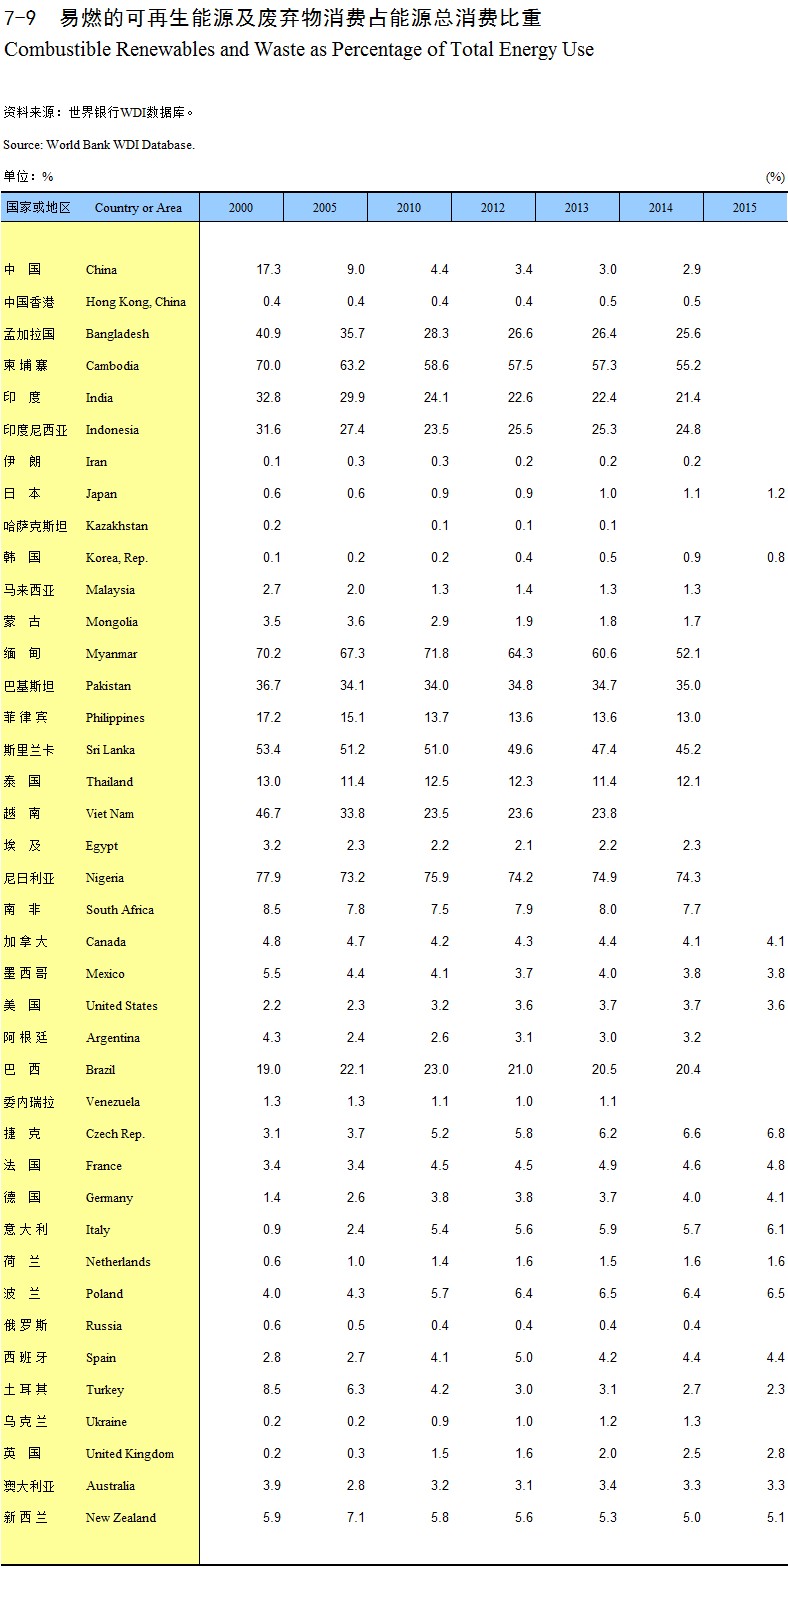
Combustible Renewables and Waste as Percentage of Total Energy Use
Explanatory Notes on Main Statistical Indicators
Government Finance and Banking
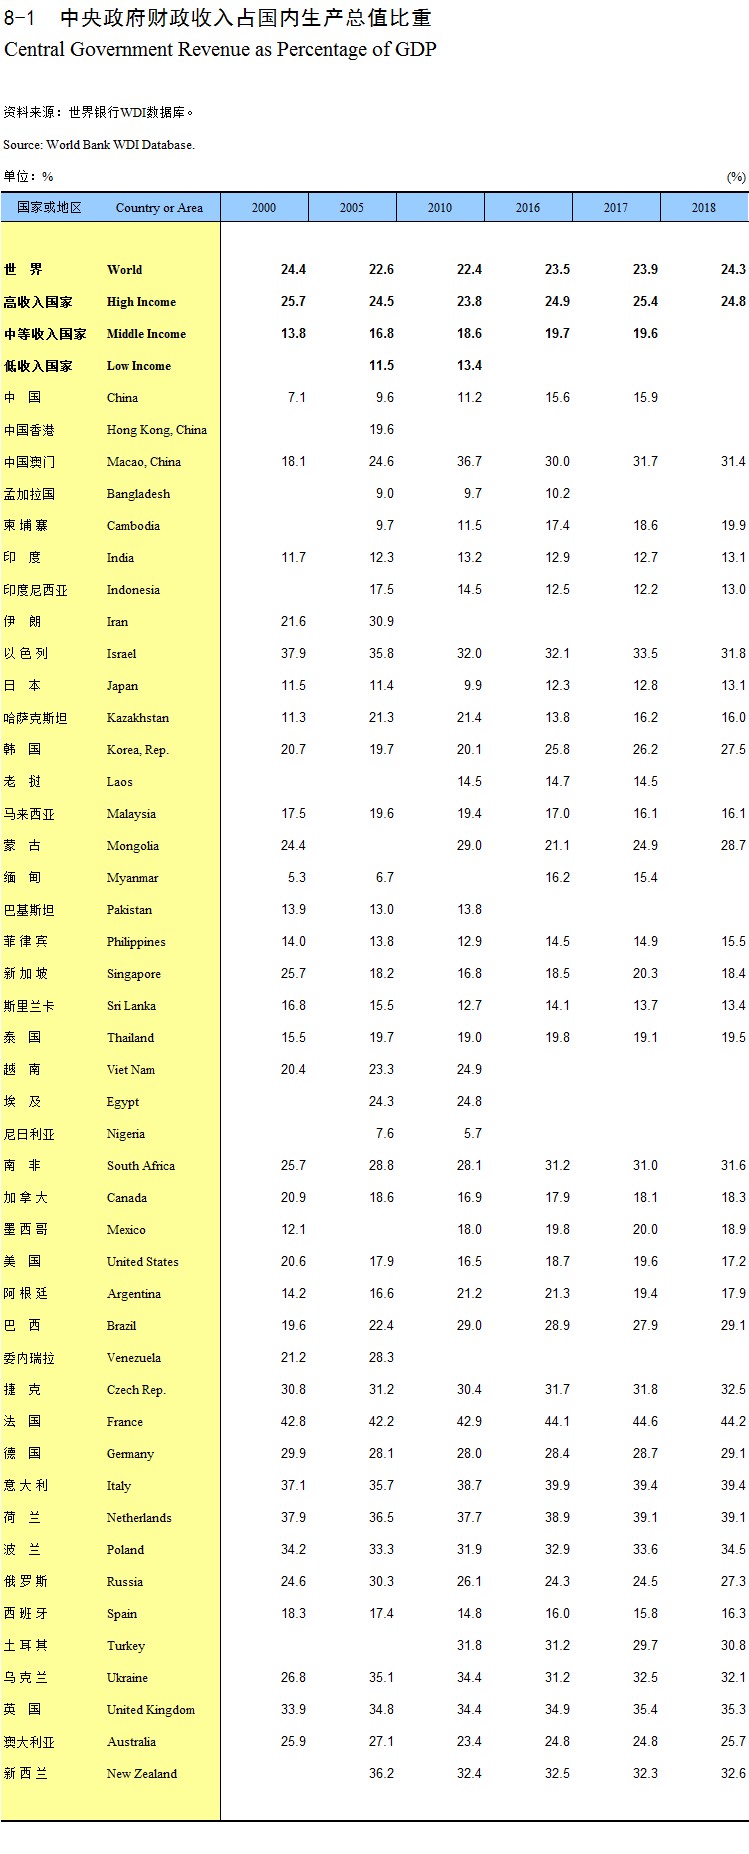
Central Government Revenue as Percentage of GDP
Revenue of Central Government
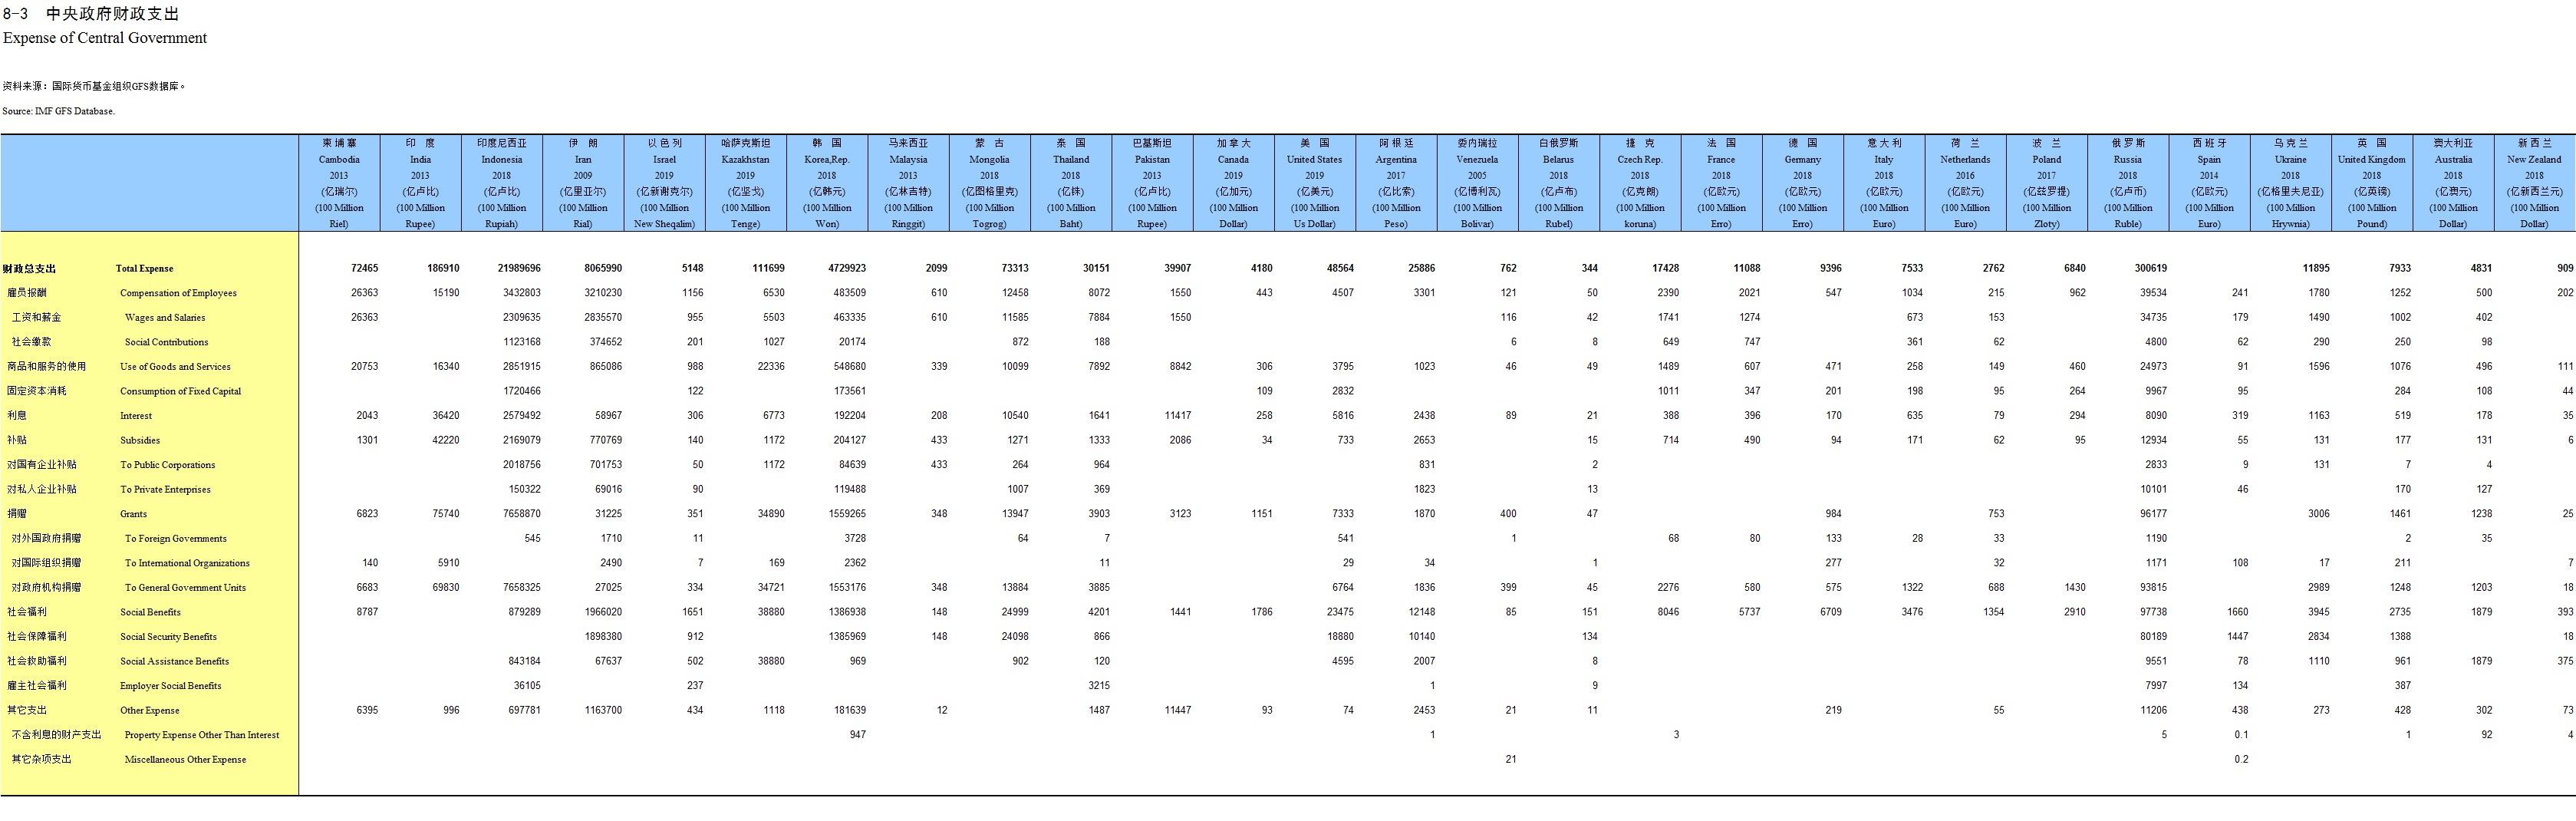
Expense of Central Government
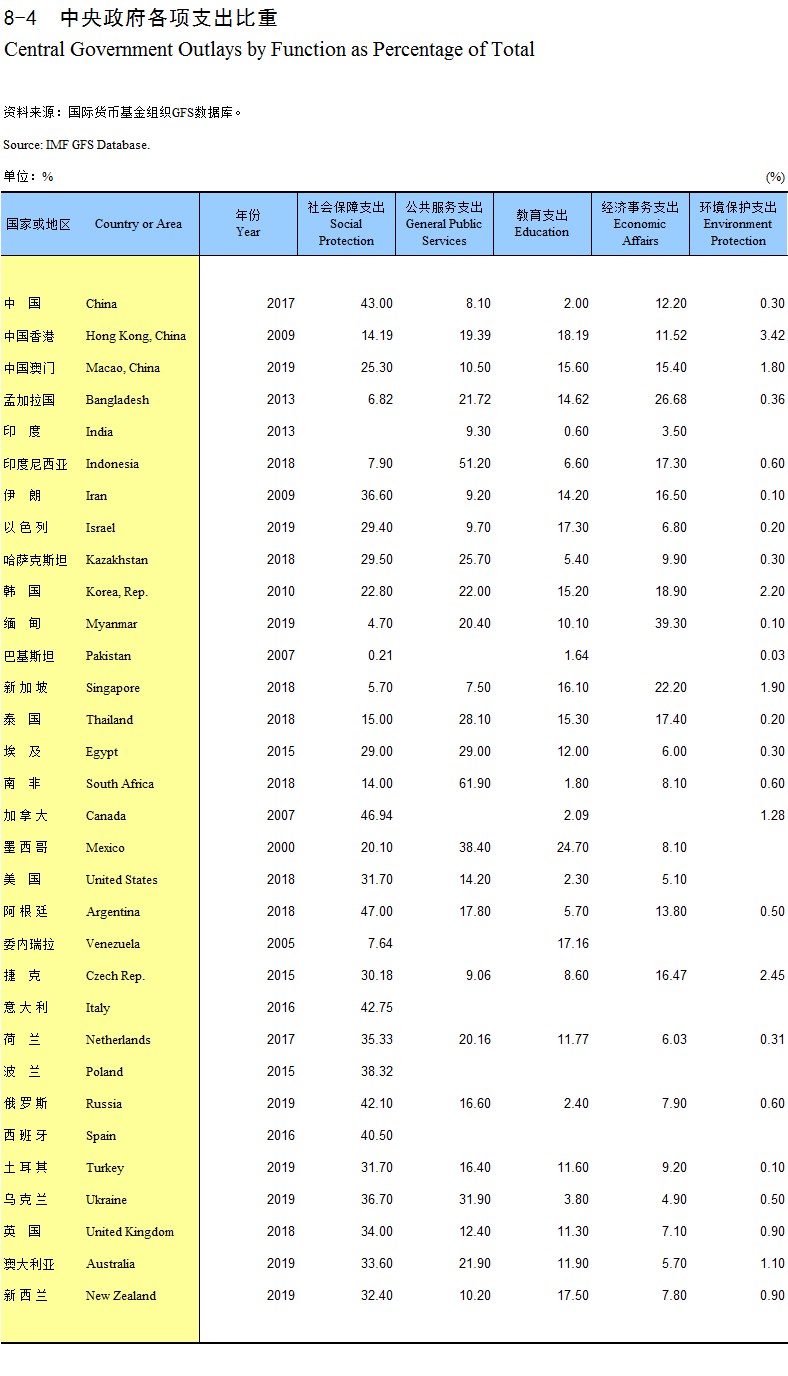
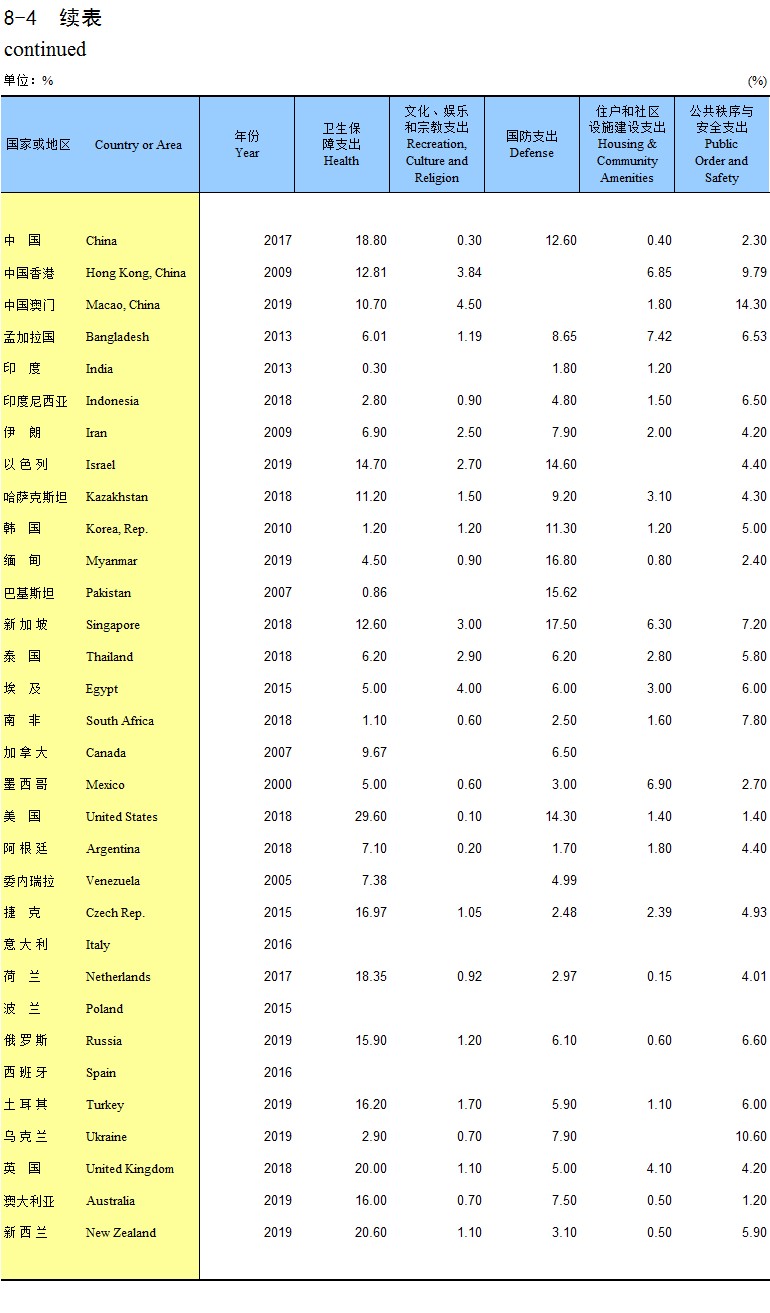
Central Government Outlays by Function as Percentage of Total
continued
Social Contributions as Percentage of Revenue
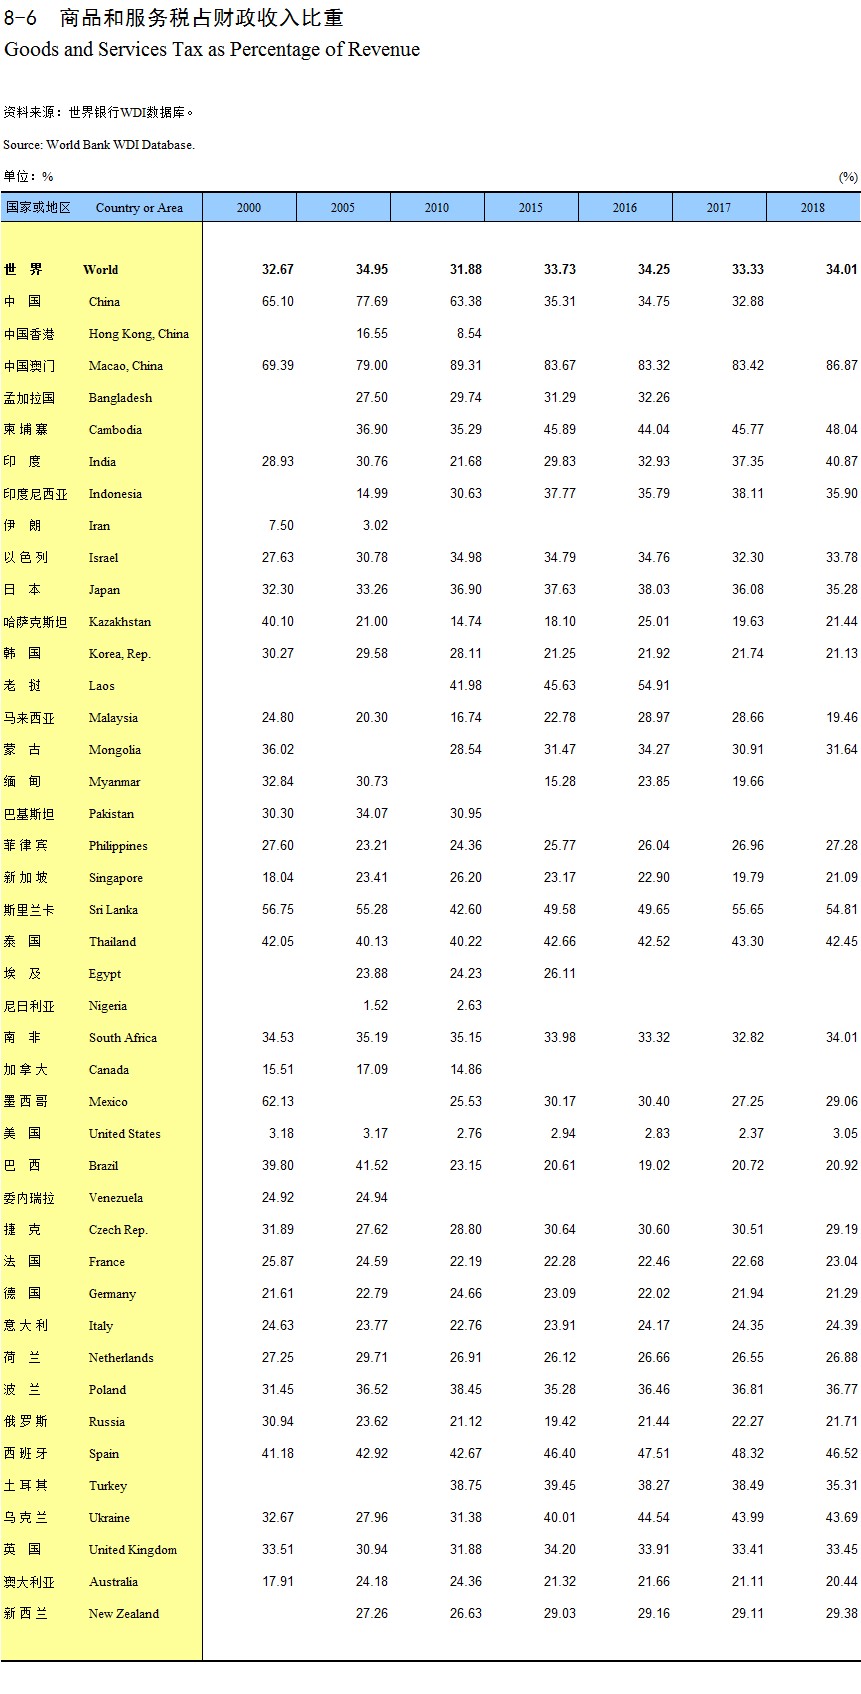
Goods and Services Tax as Percentage of Revenue
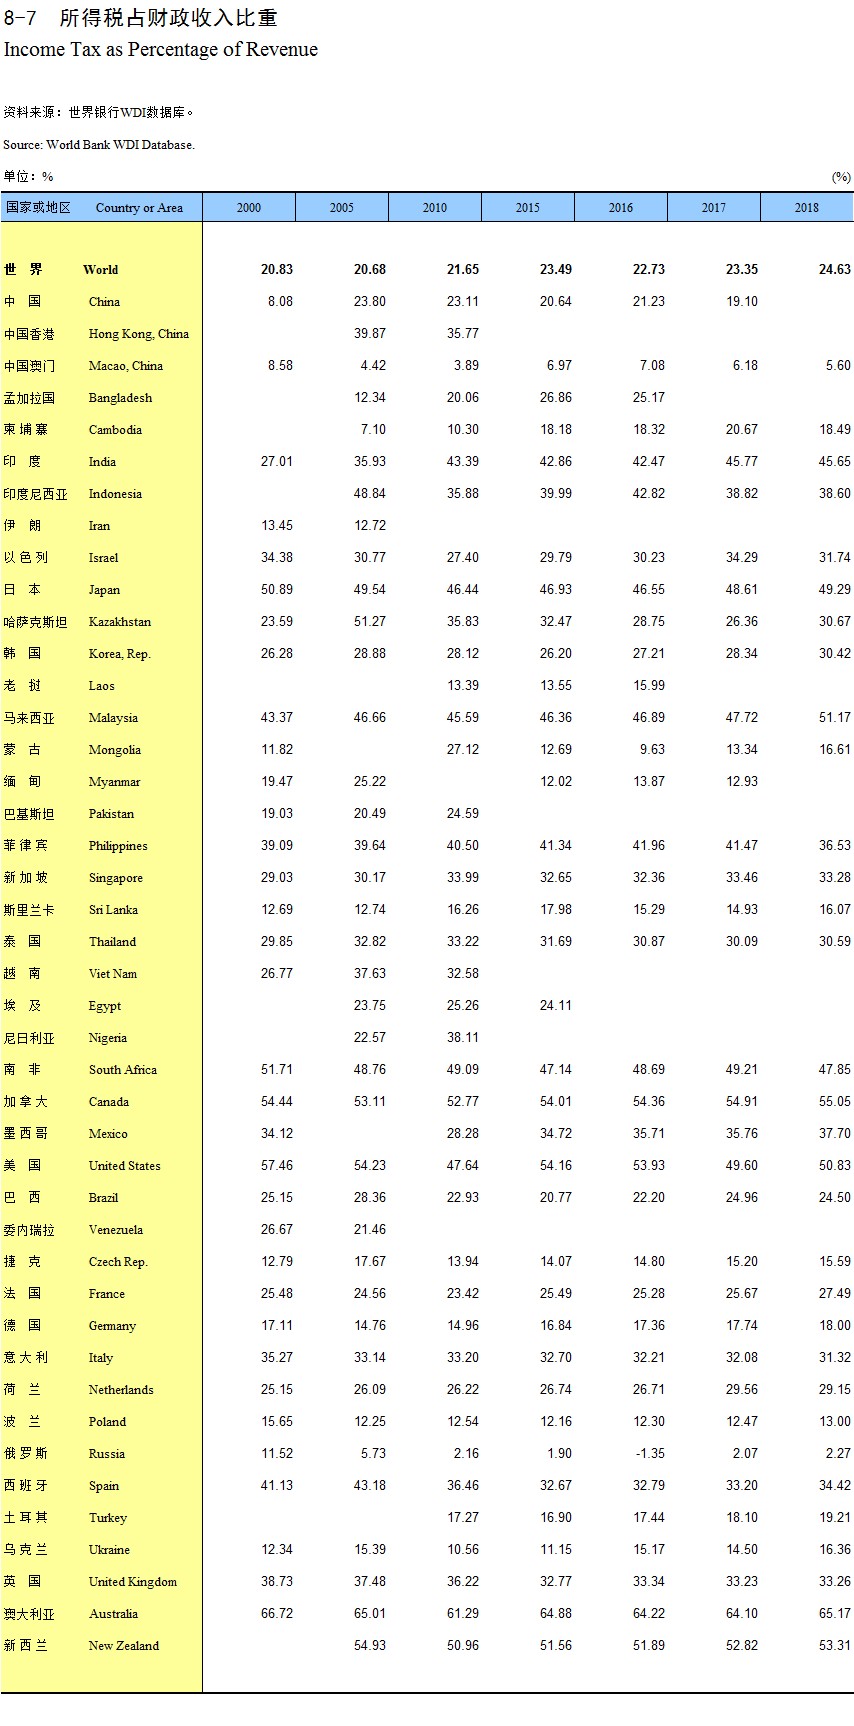
Income Tax as Percentage of Revenue
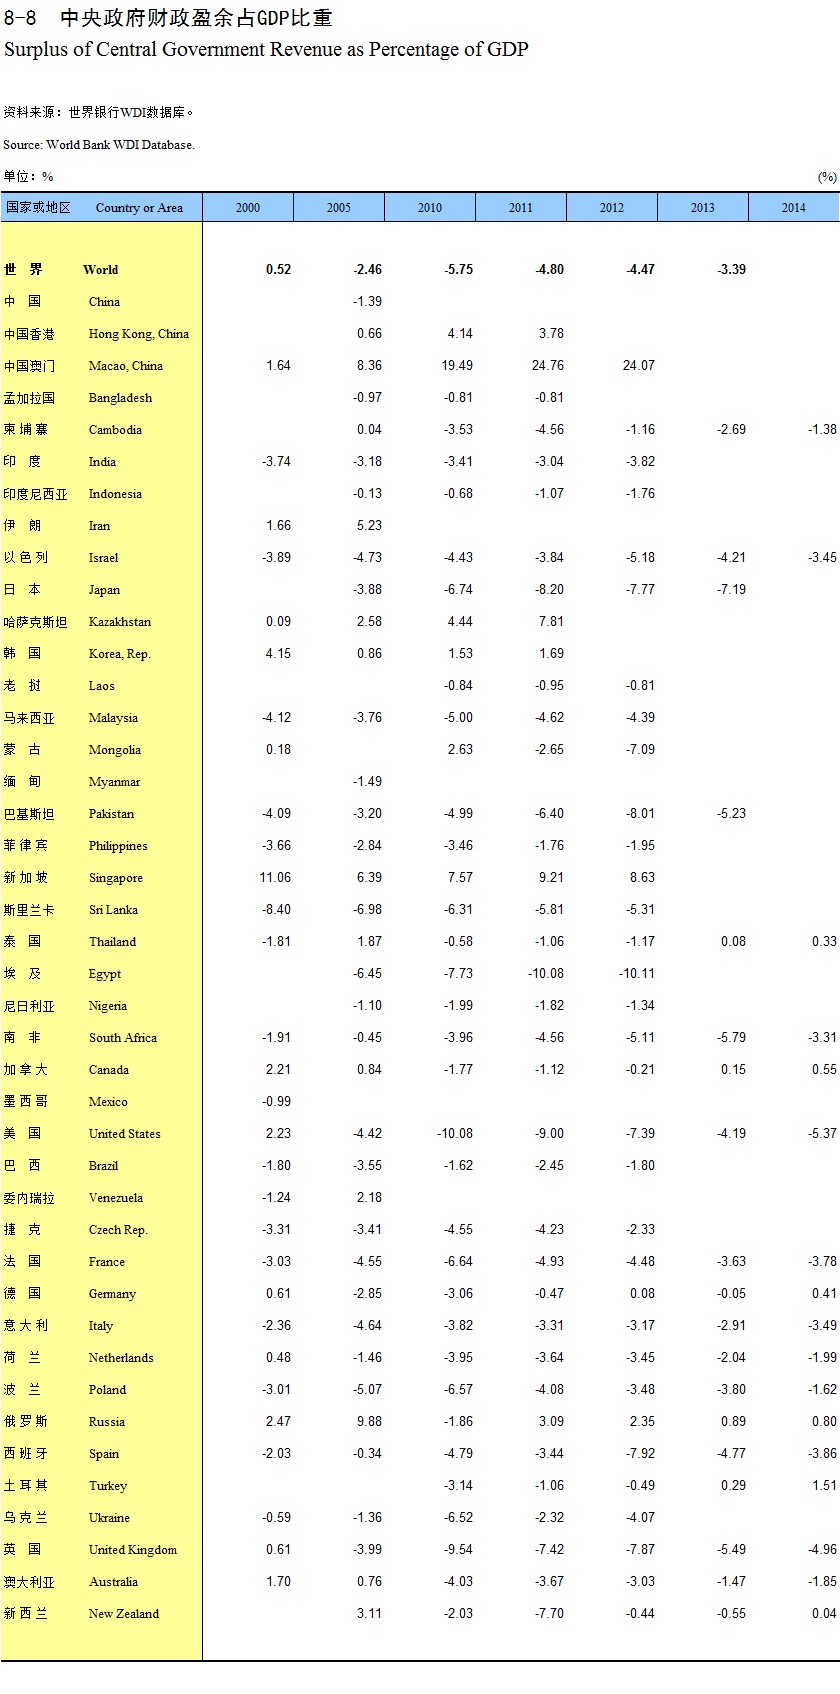
Surplus of Central Government Revenue as Percentage of GDP
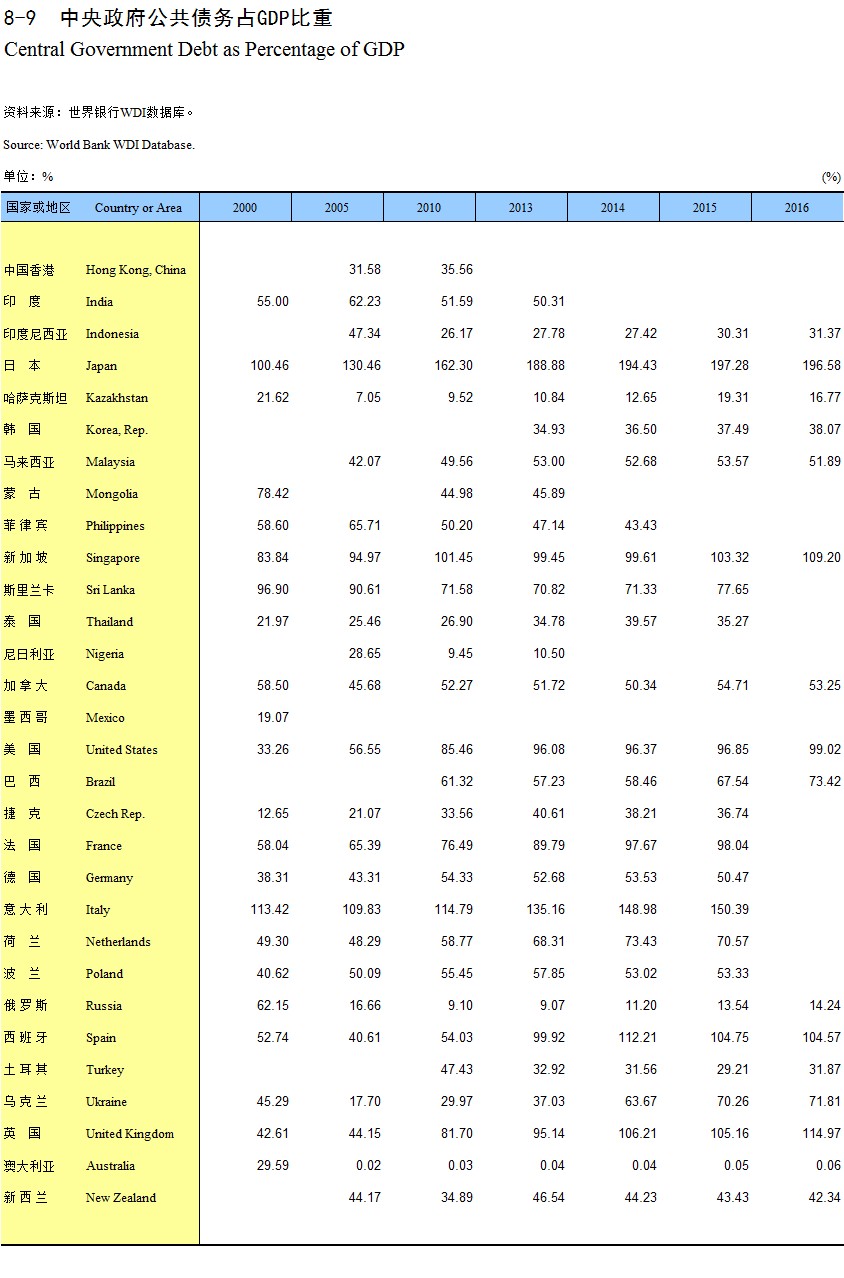
Central Government Debt as Percentage of GDP
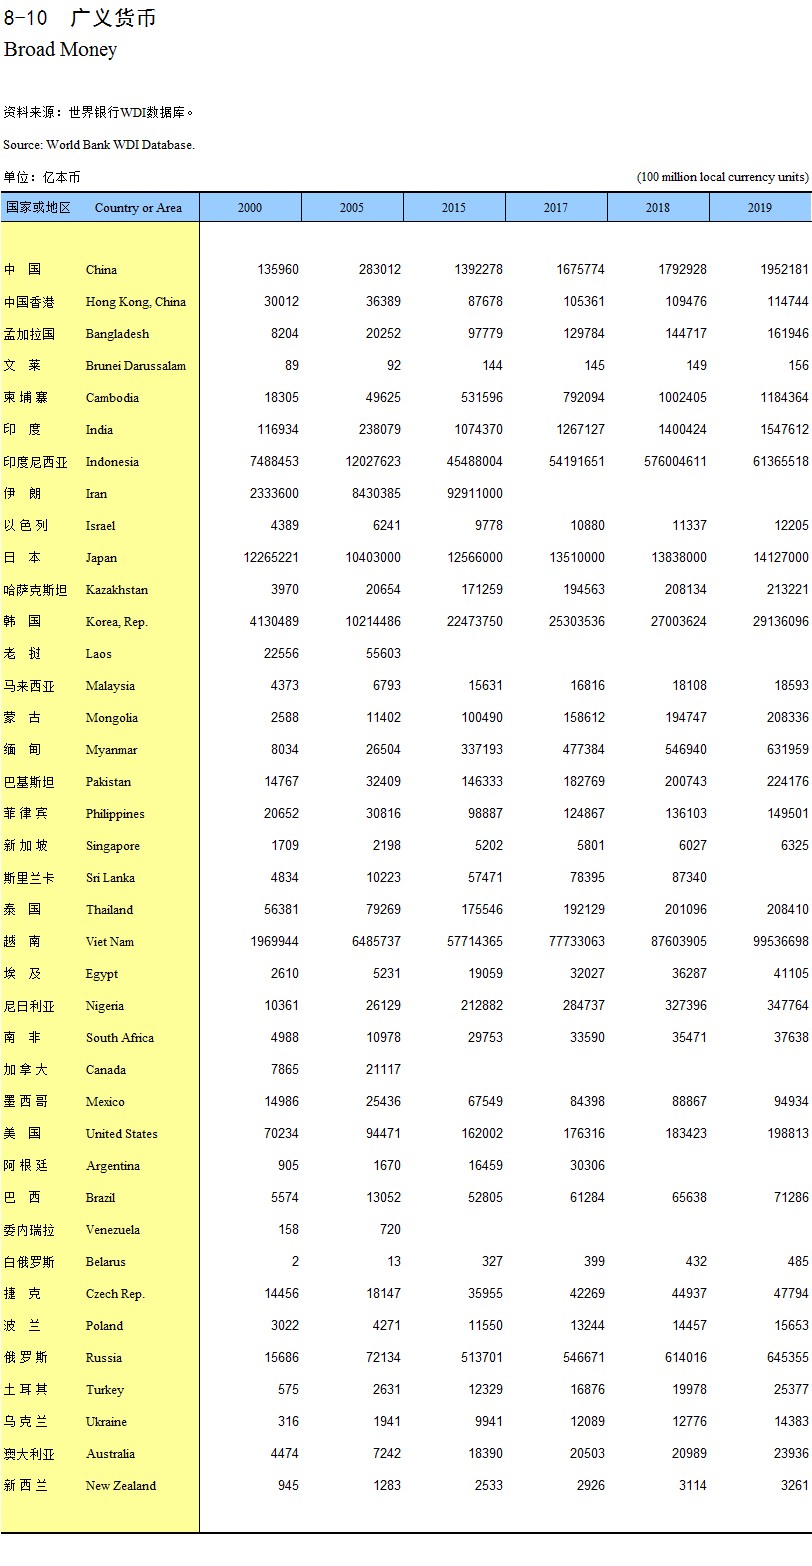
Broad Money
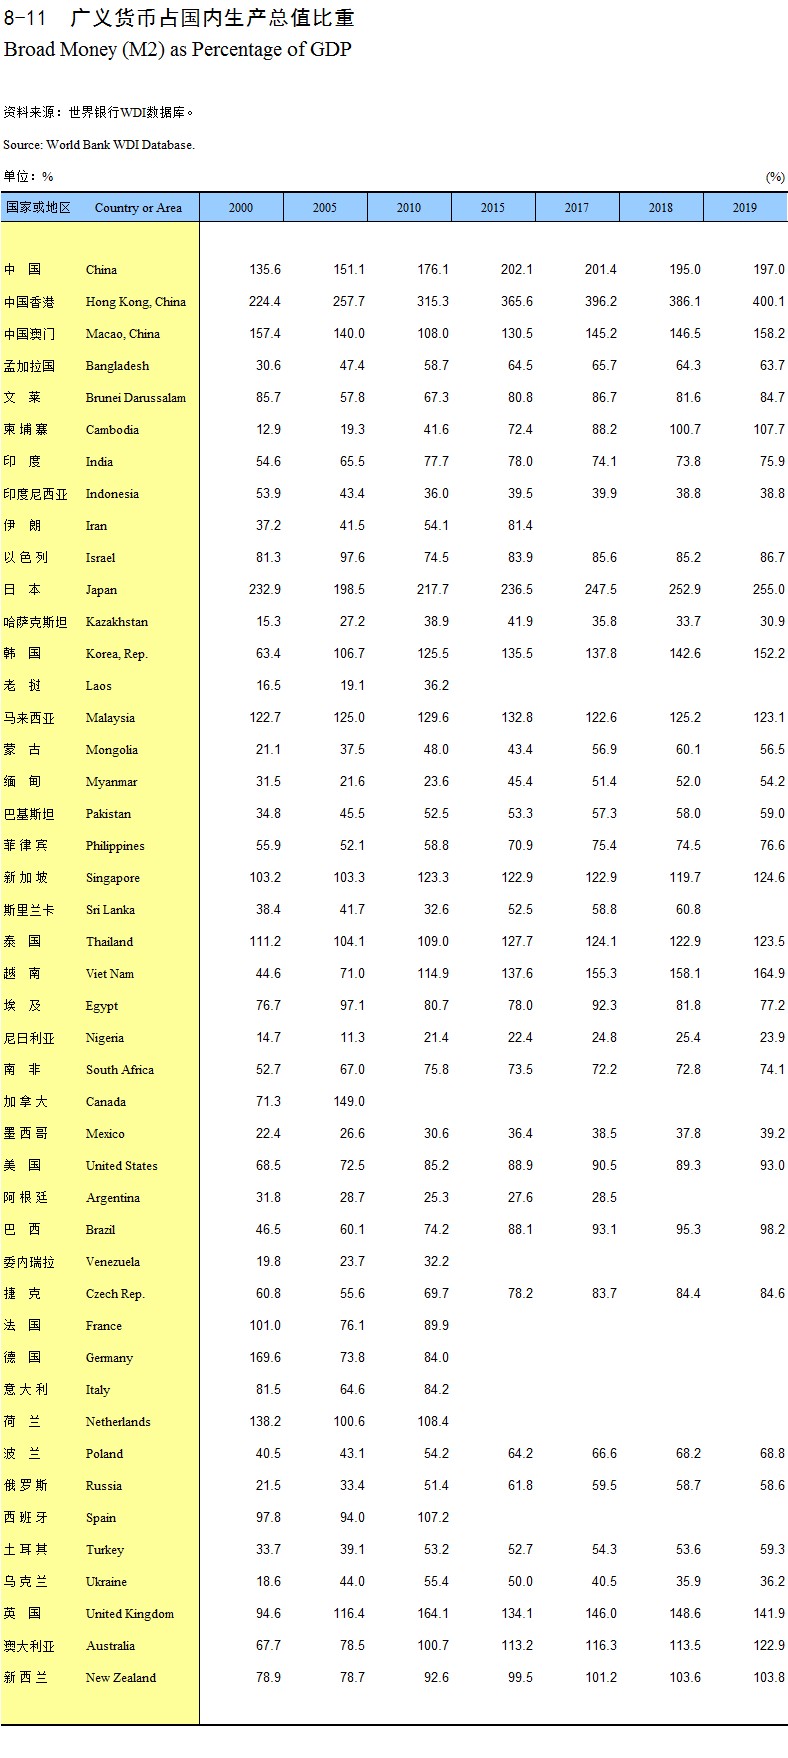
Broad Money (M2) as Percentage of GDP
Growth Rate of Broad Money
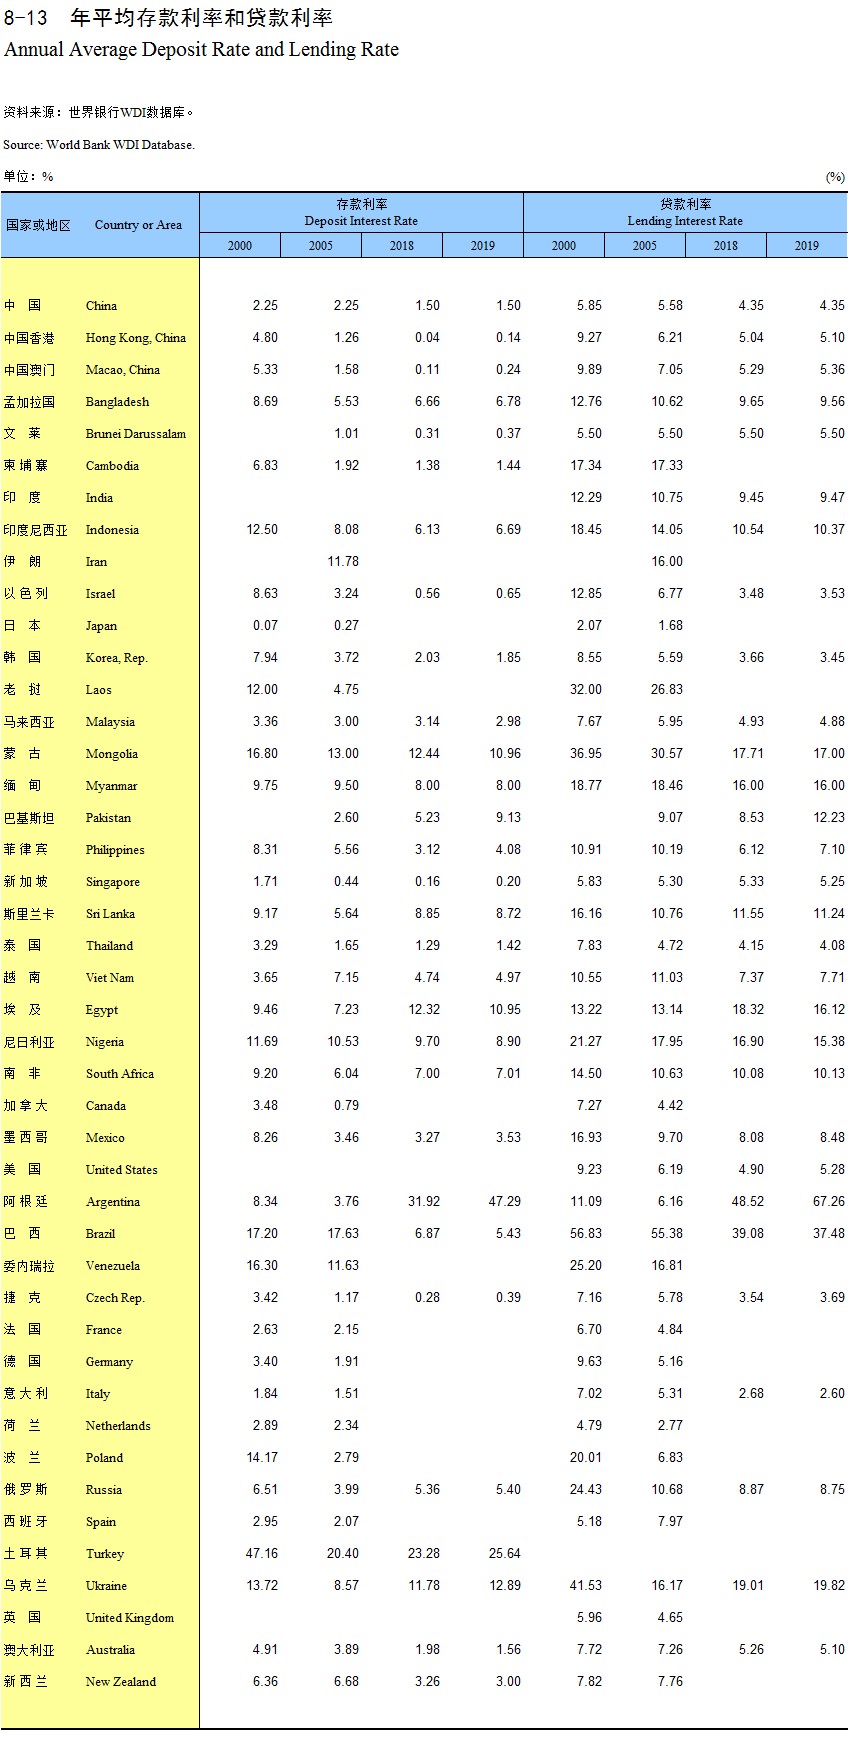
Annual Average Deposit Rate and Lending Rate
Bank Non-performing Loans as Percentage of Total
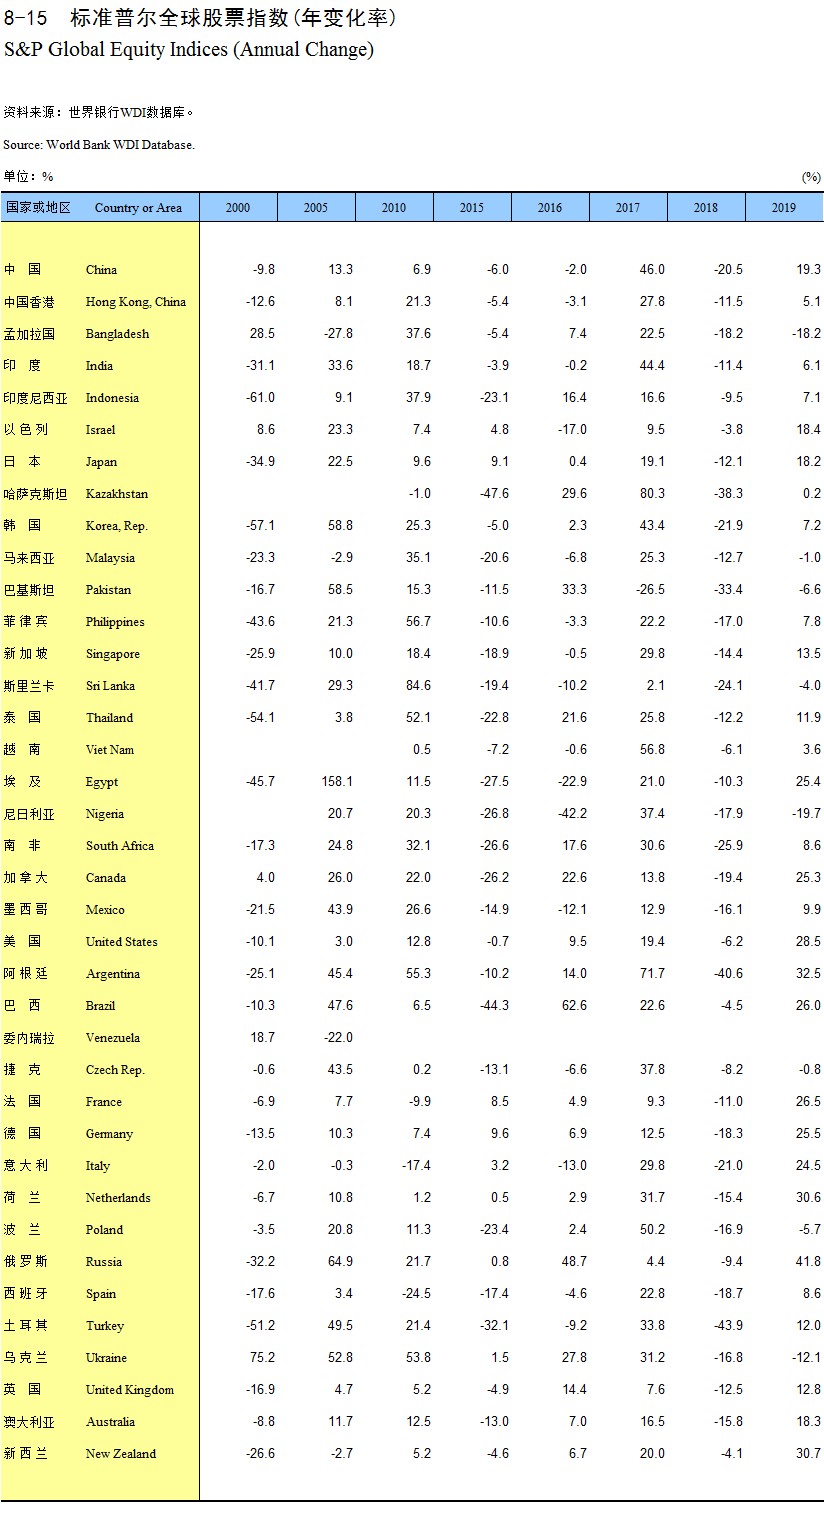
S&P Global Equity Indices (Annual Change)
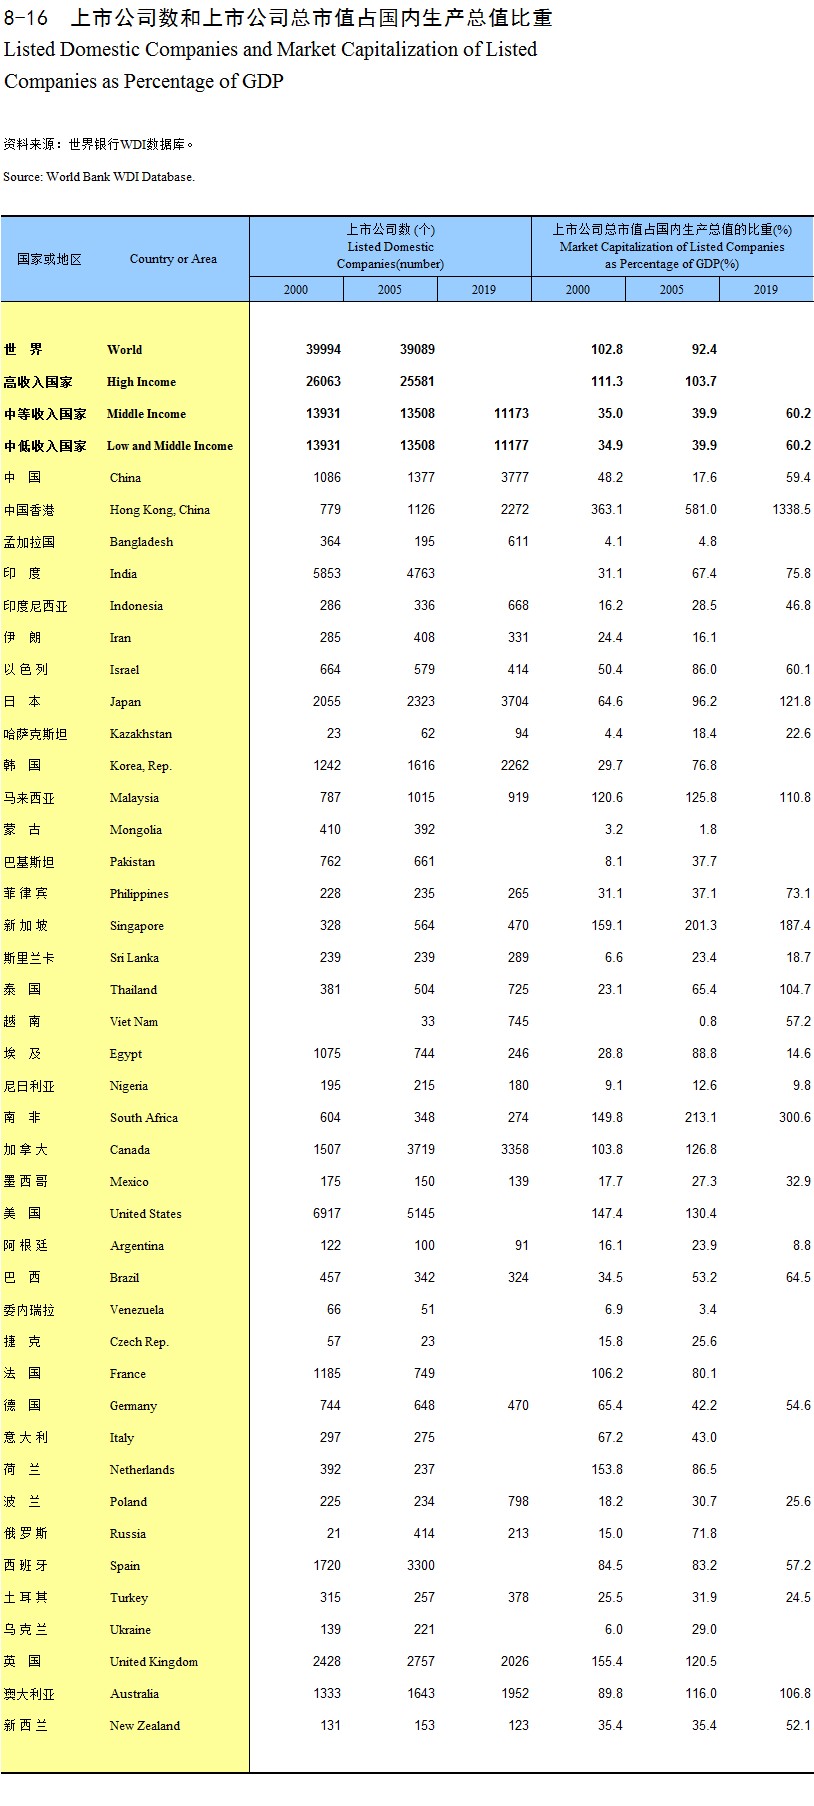
Listed Domestic Companies and Market Capitalization of Listed Companies as Percentage of GDP
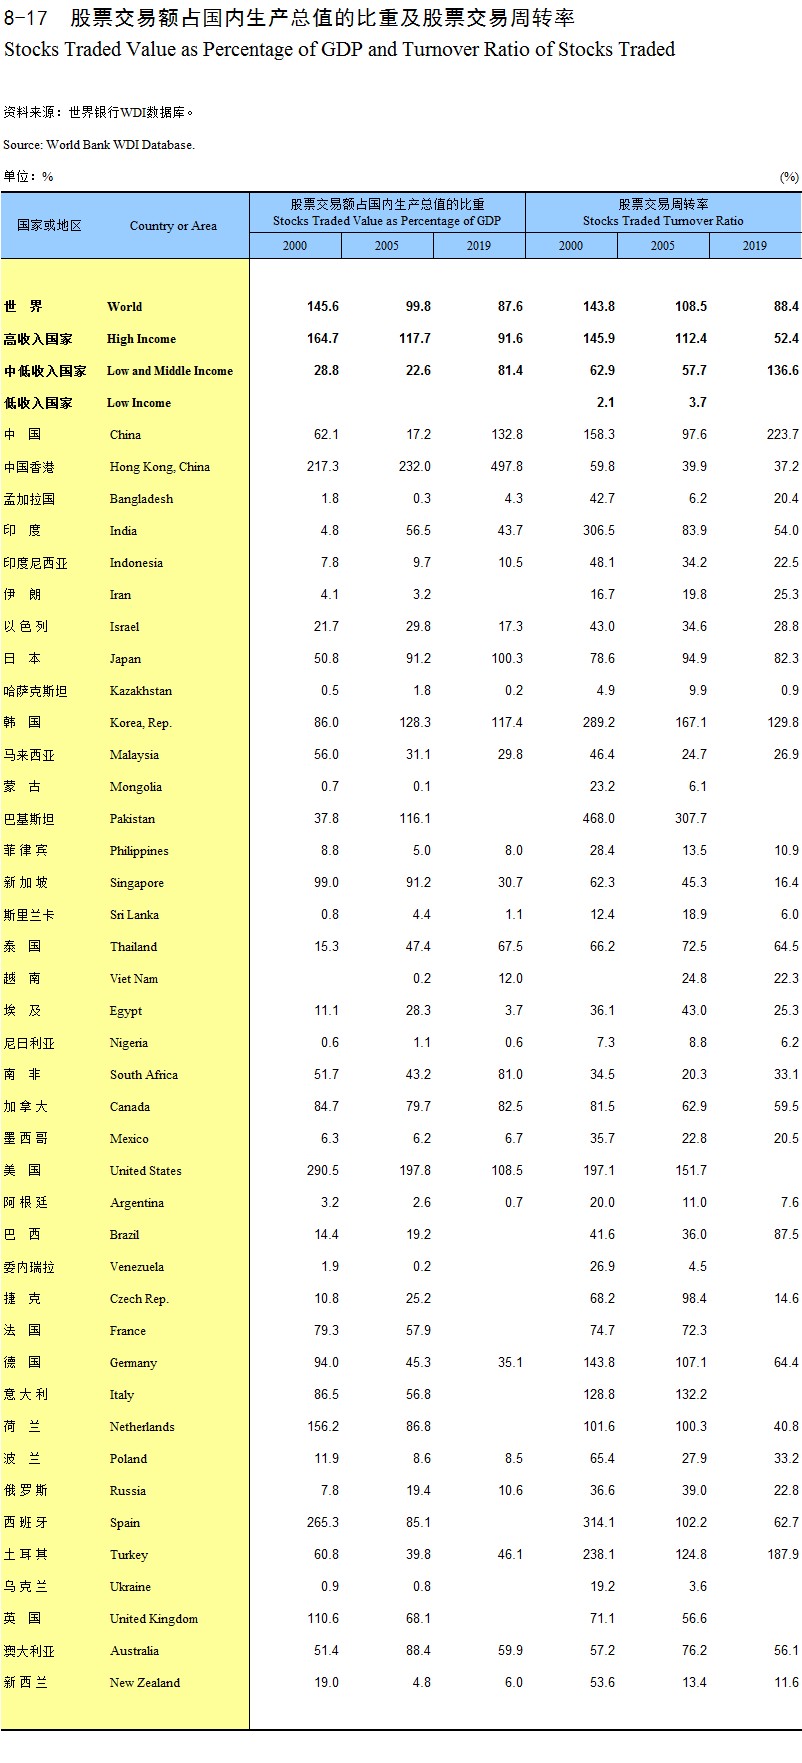
Stocks Traded Value as Percentage of GDP and Turnover Ratio of Stocks Traded
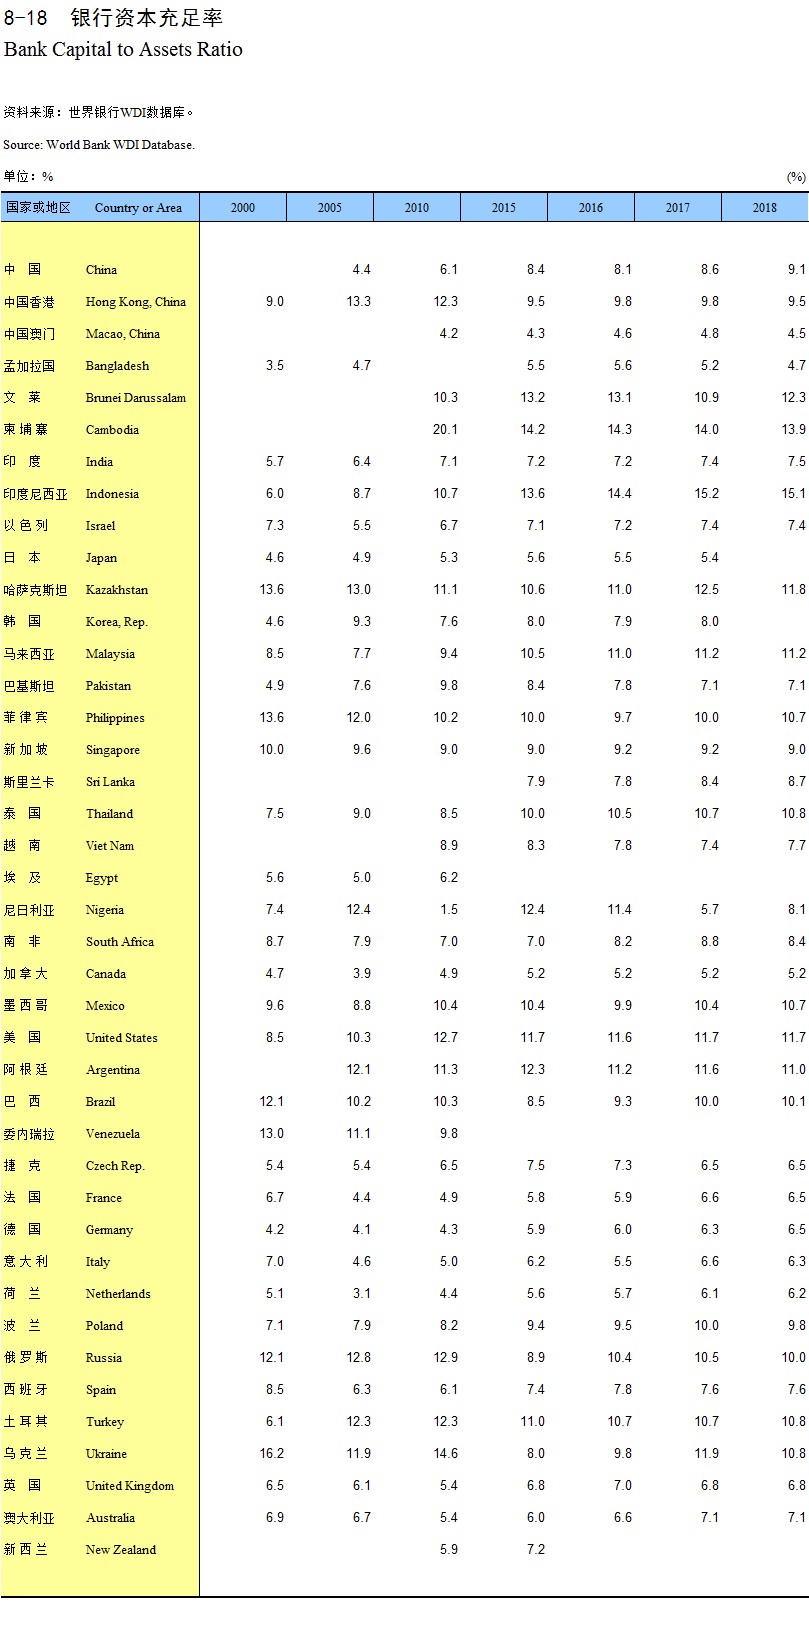
Bank Capital to Assets Ratio
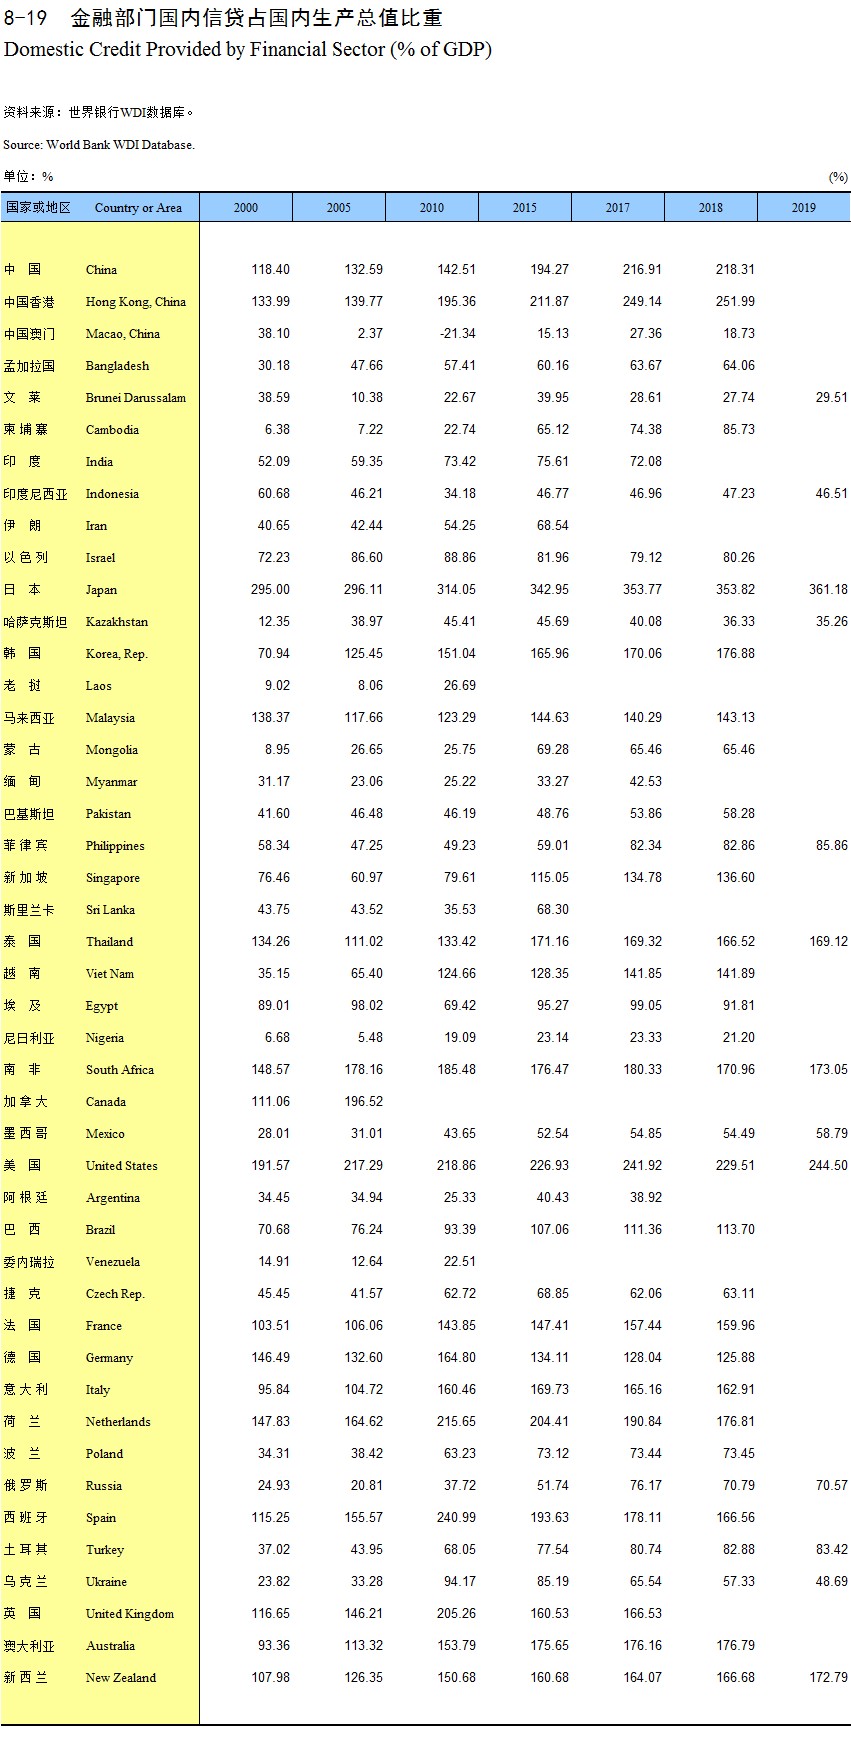
Domestic Credit Provided by Financial Sector (% of GDP)
Explanatory Notes on Main Statistical Indicators
Price Indices
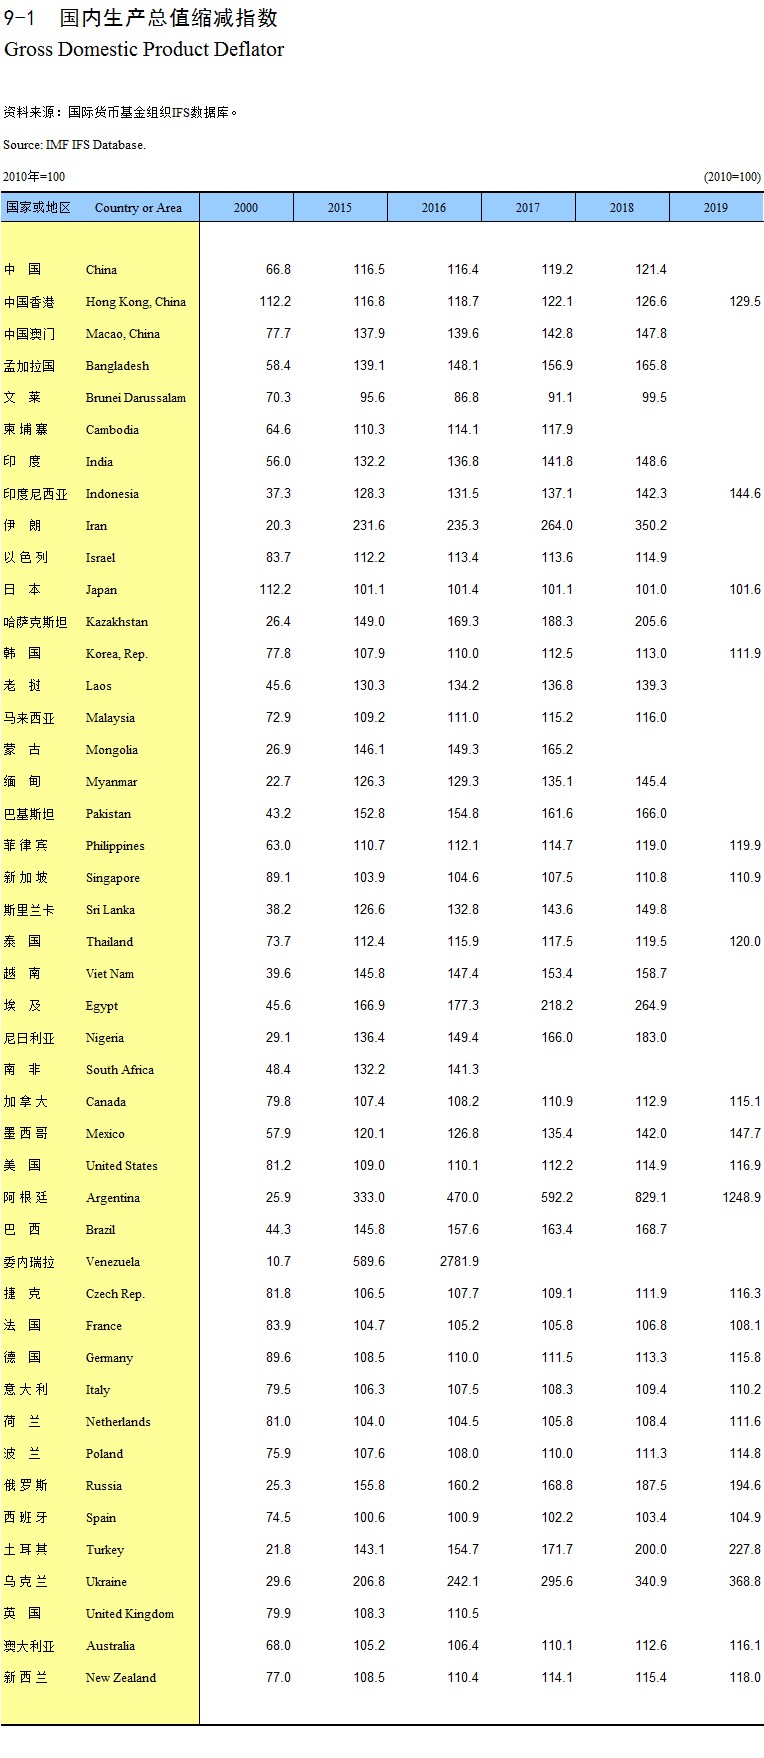
Gross Domestic Product Deflator
Producer Price Indices
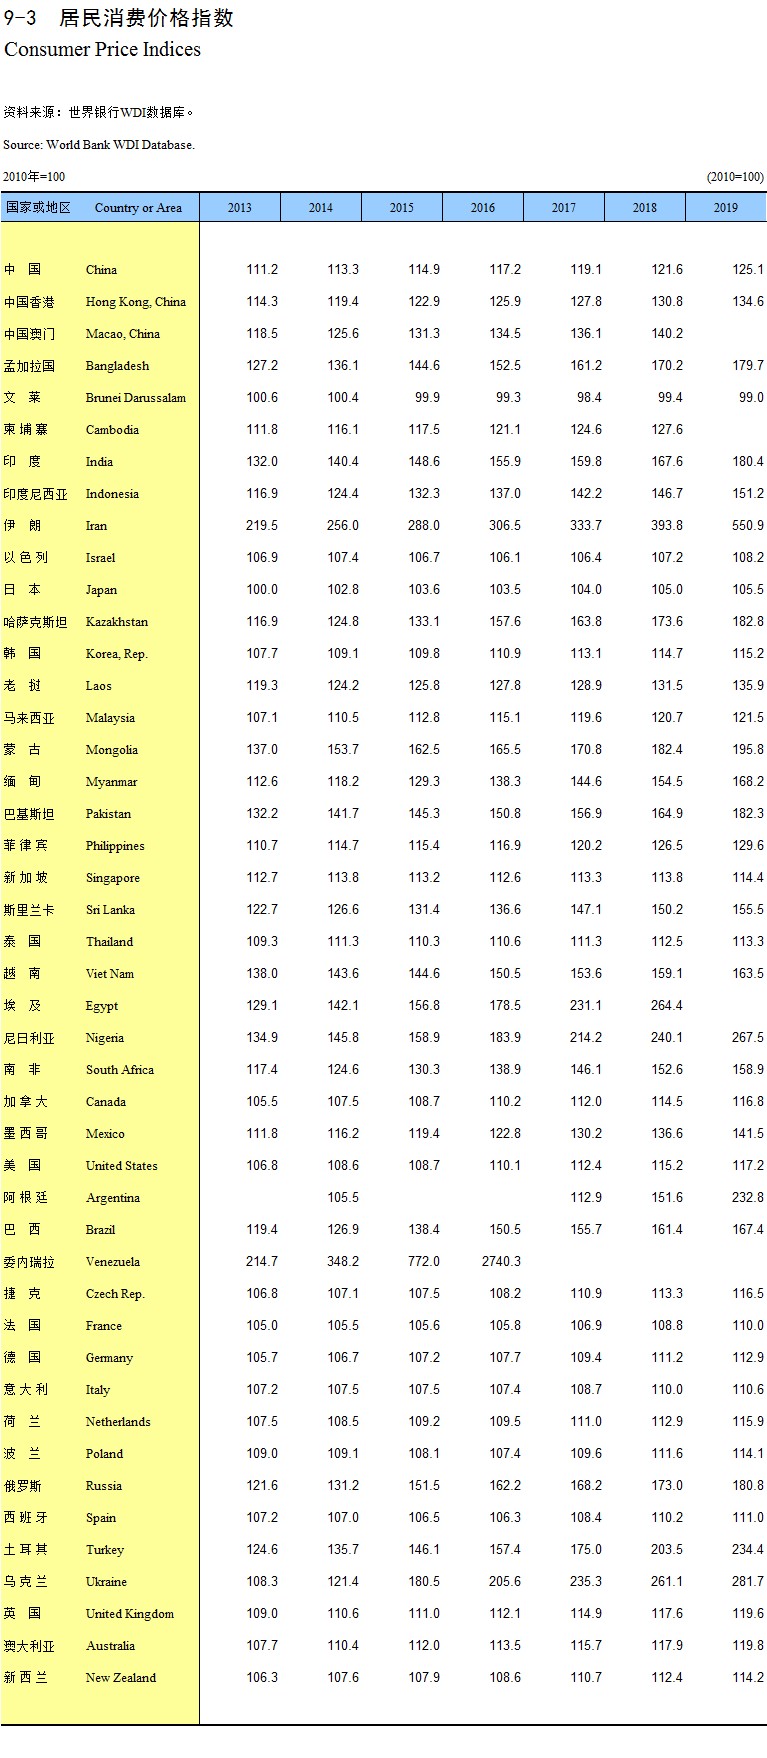
Consumer Price Indices
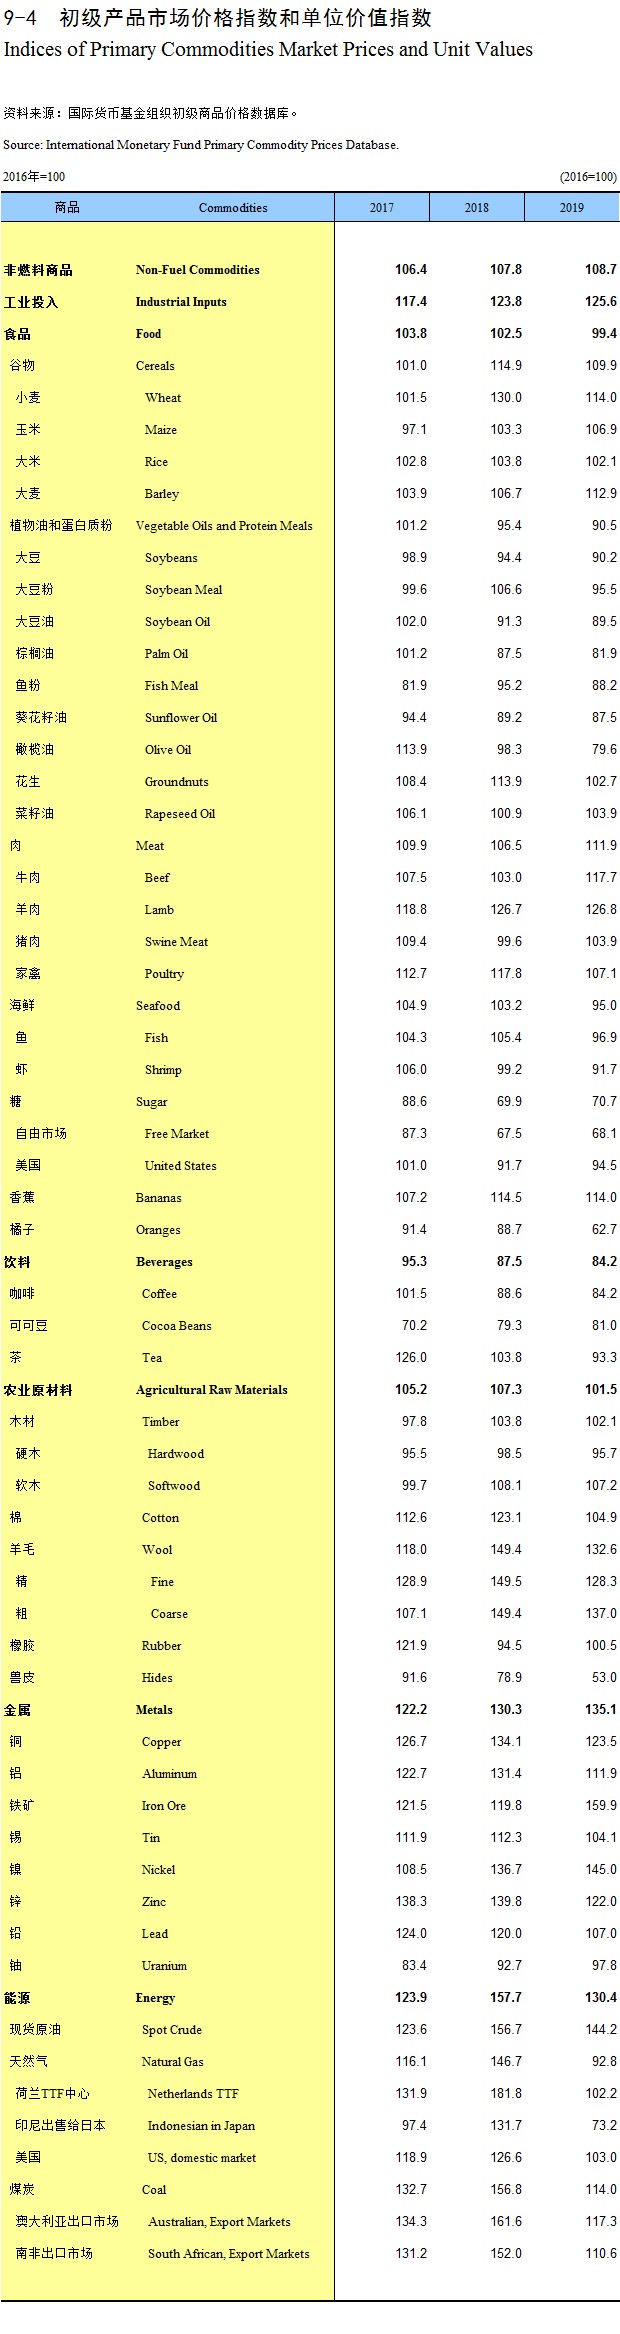
Indices of Primary Commodities Market Prices and Unit Values
Explanatory Notes on Main Statistical Indicators
Household Income and Expenditure and Poverty
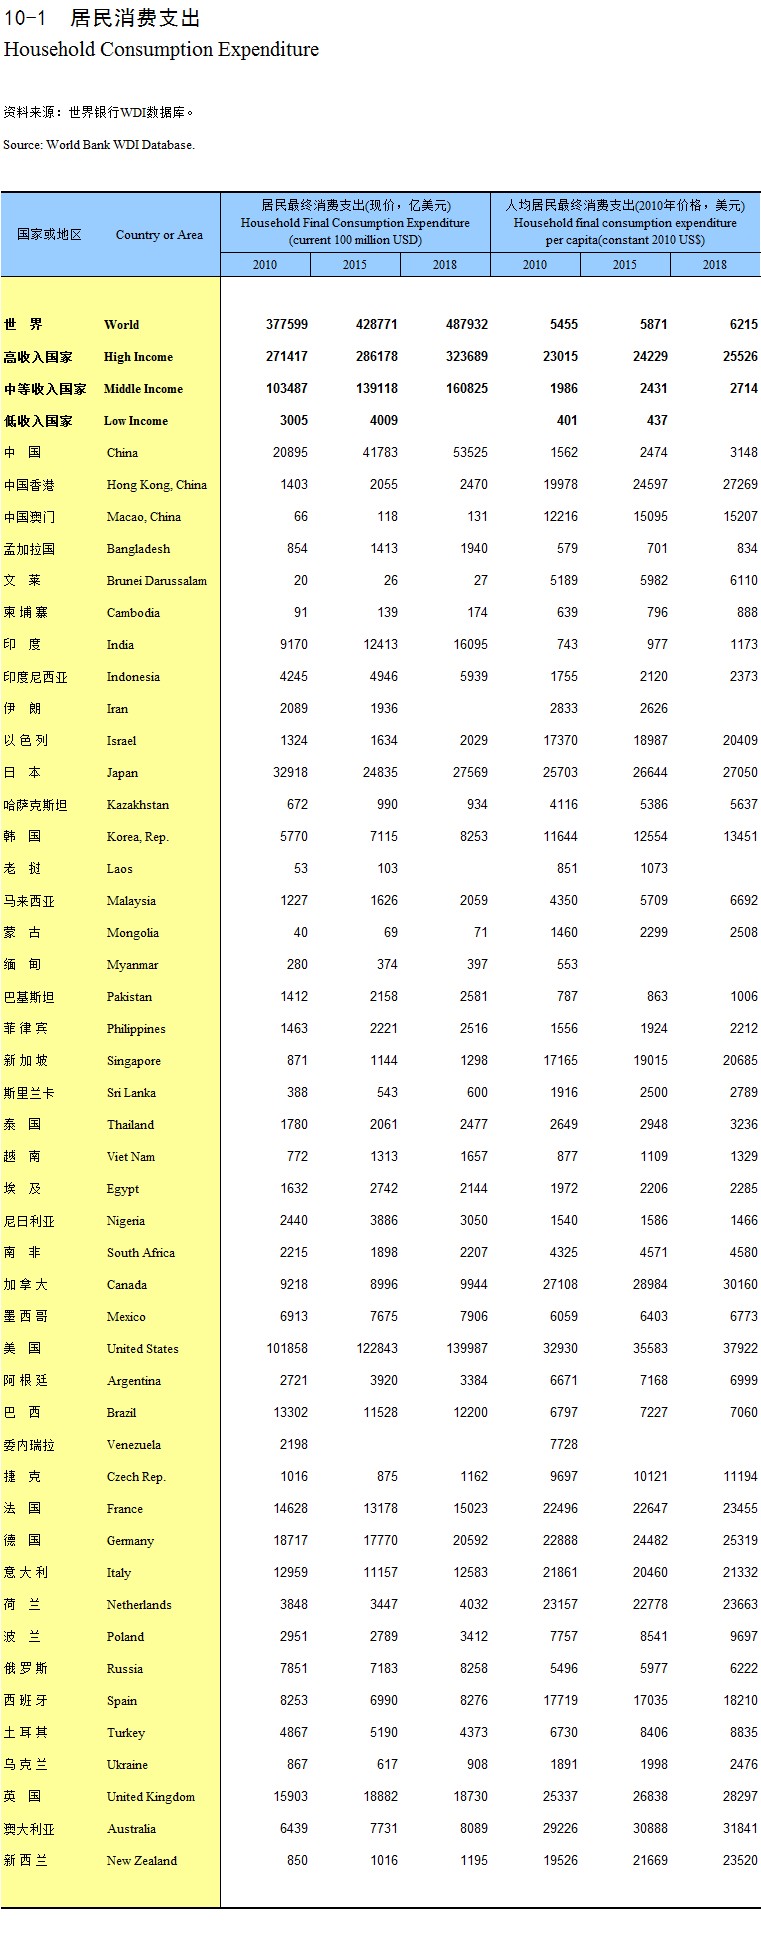
Household Consumption Expenditure
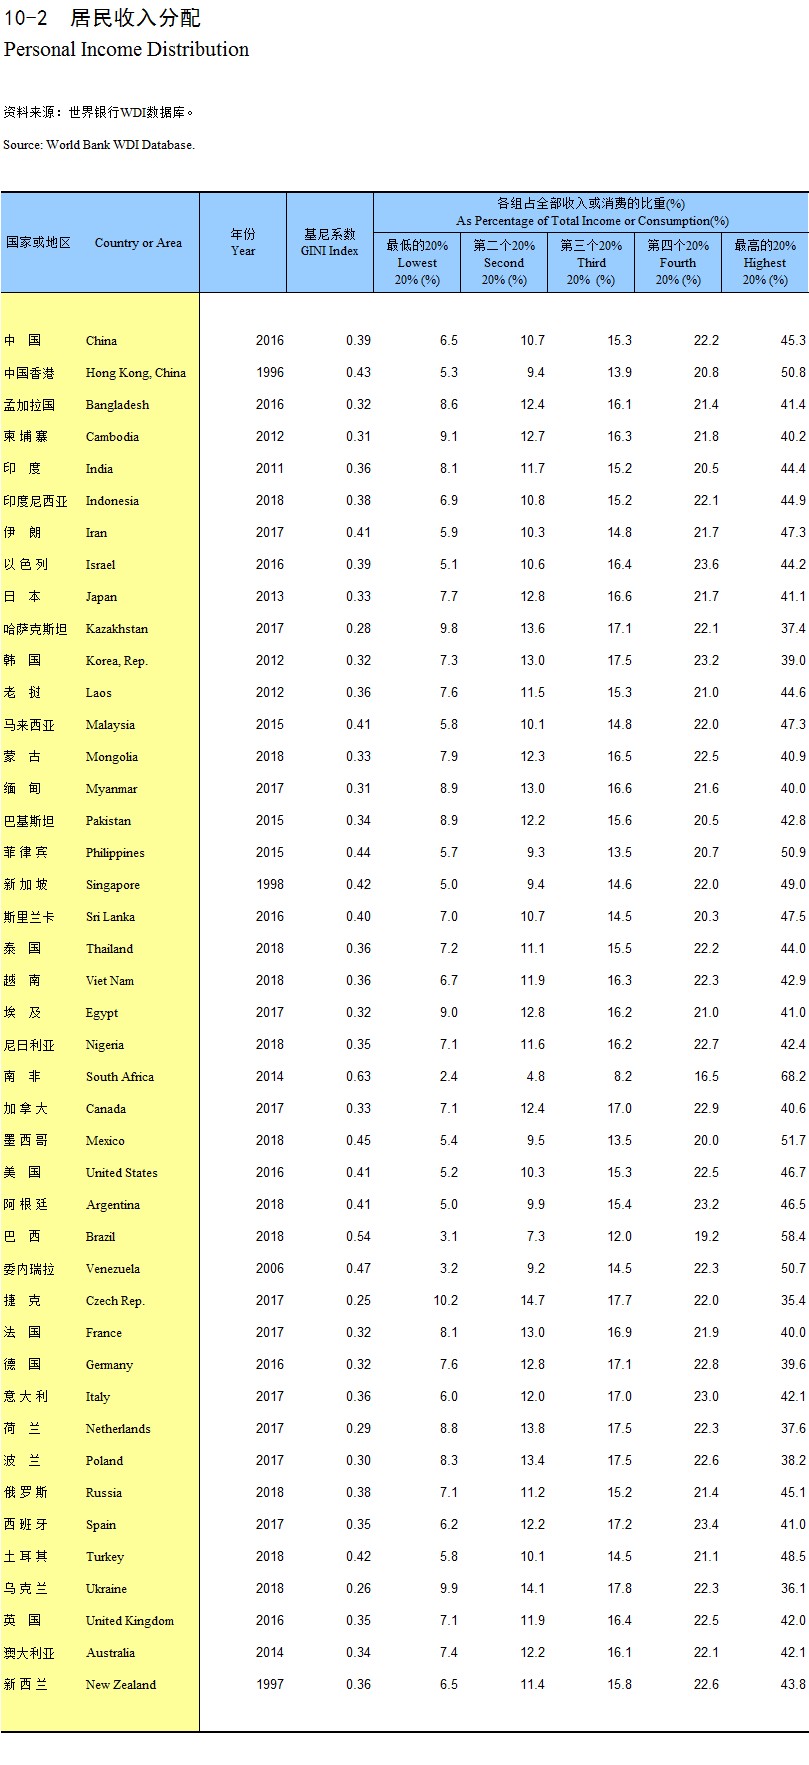
Personal Income Distribution
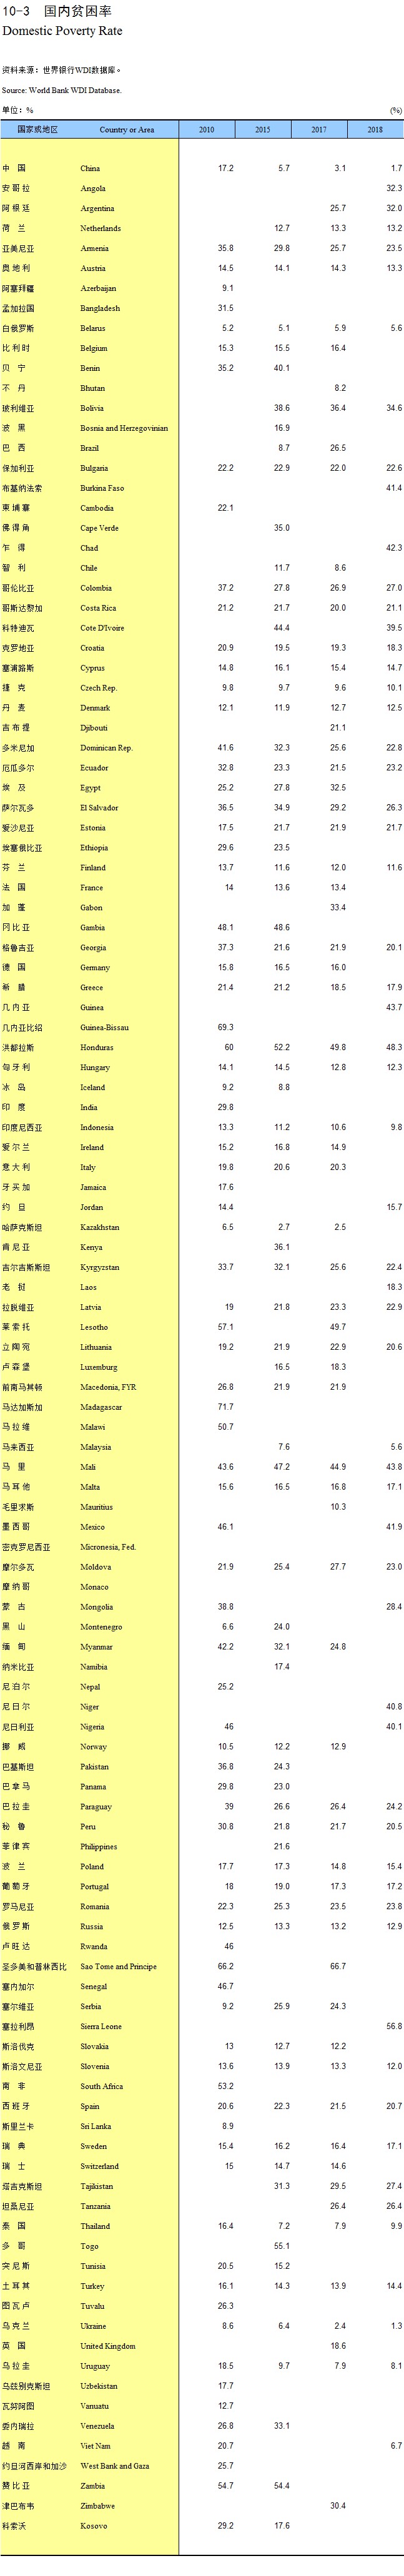
Domestic Poverty Rate
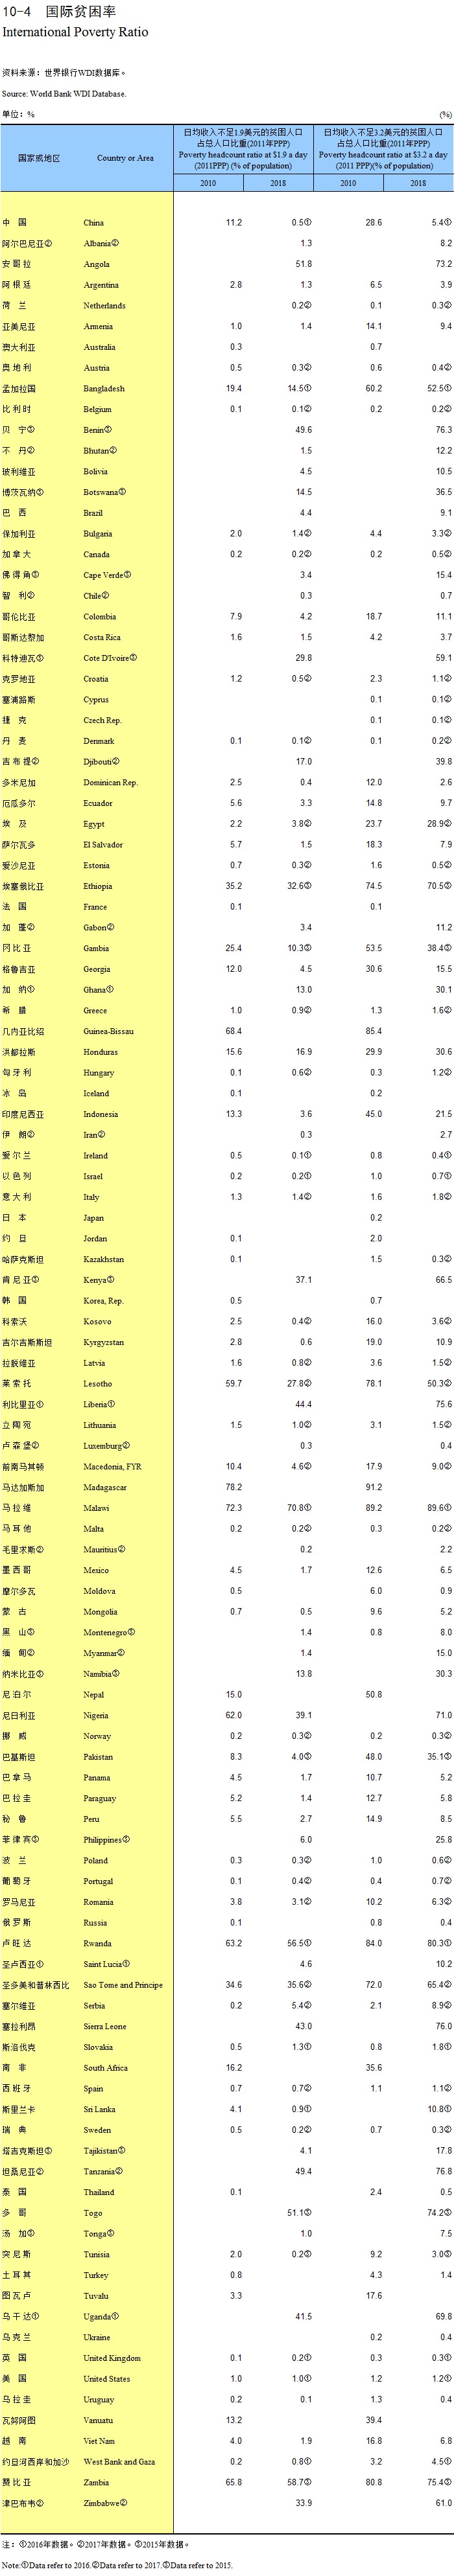
International Poverty Ratio
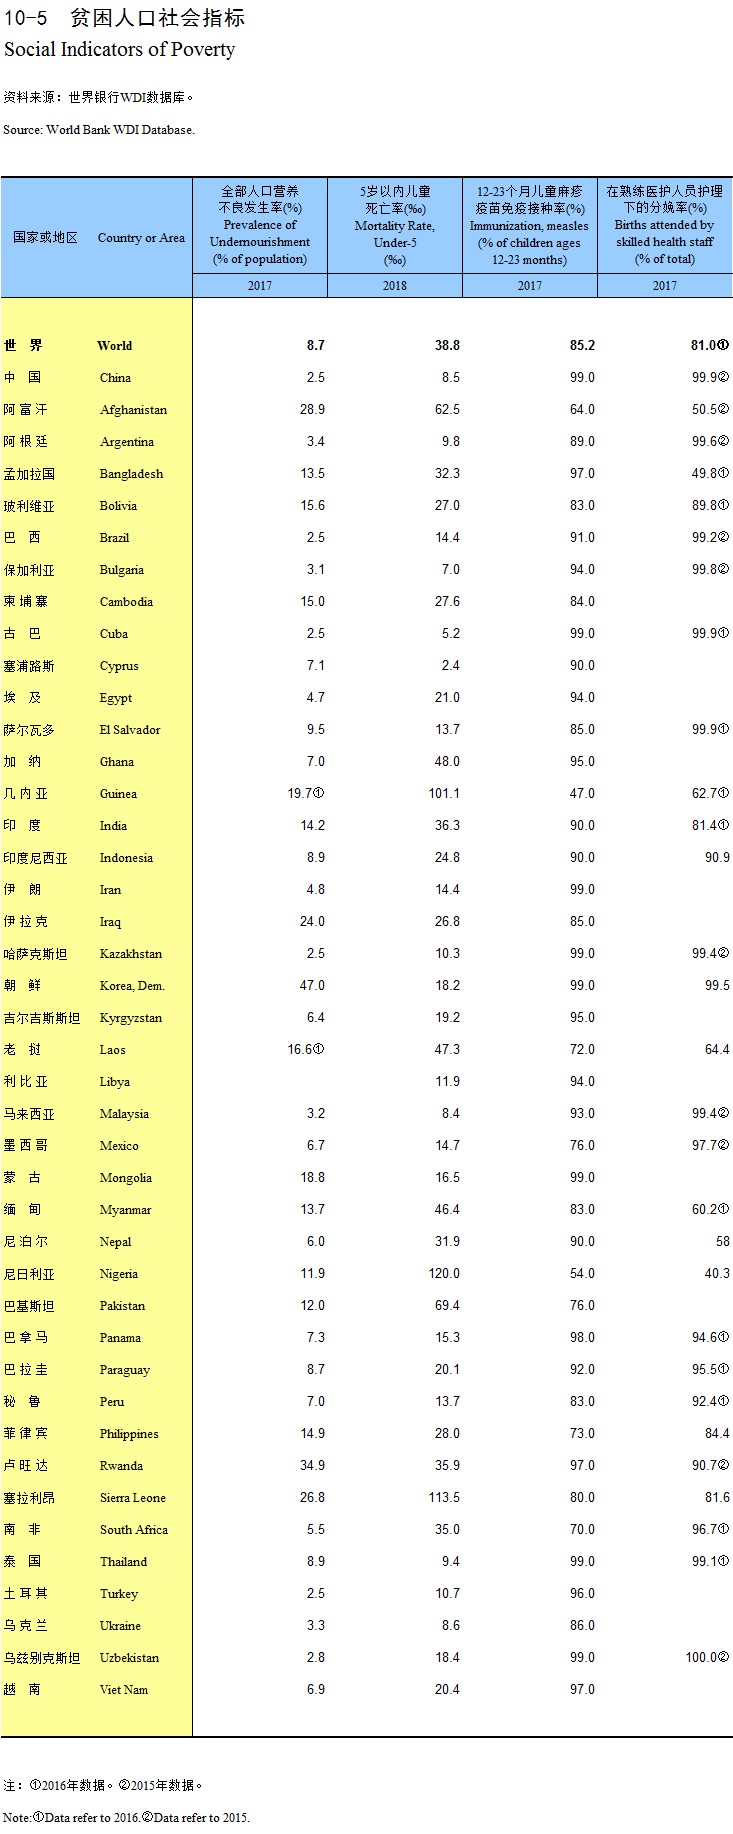
Social Indicators of Poverty
Composition of Household Final Consumption Expenditure
Explanatory Notes on Main Statistical Indicators
Agriculture
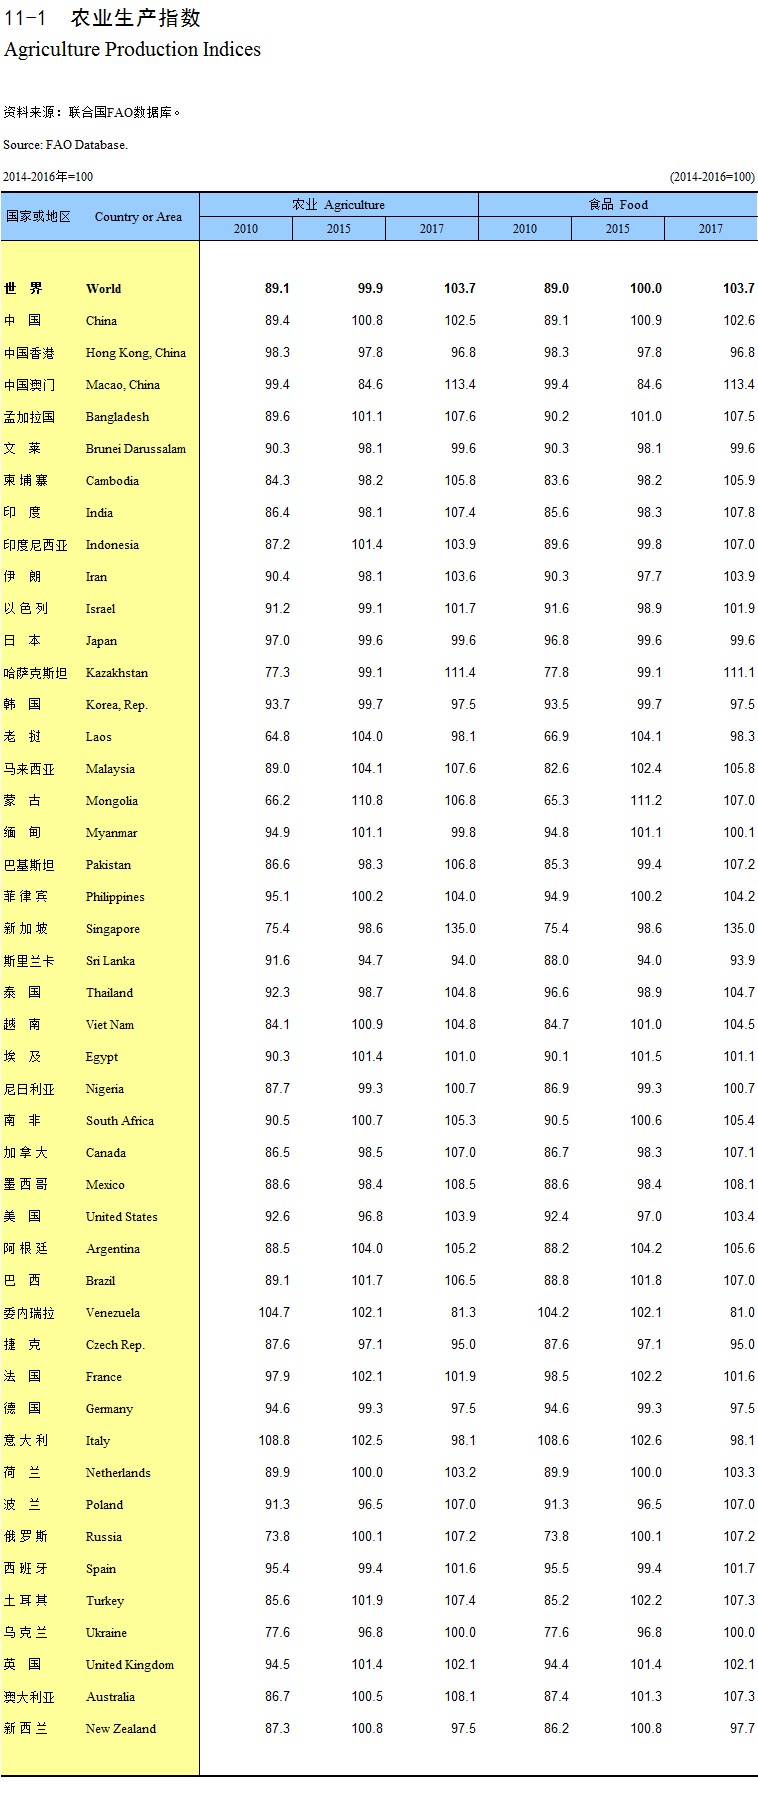
Agriculture Production Indices
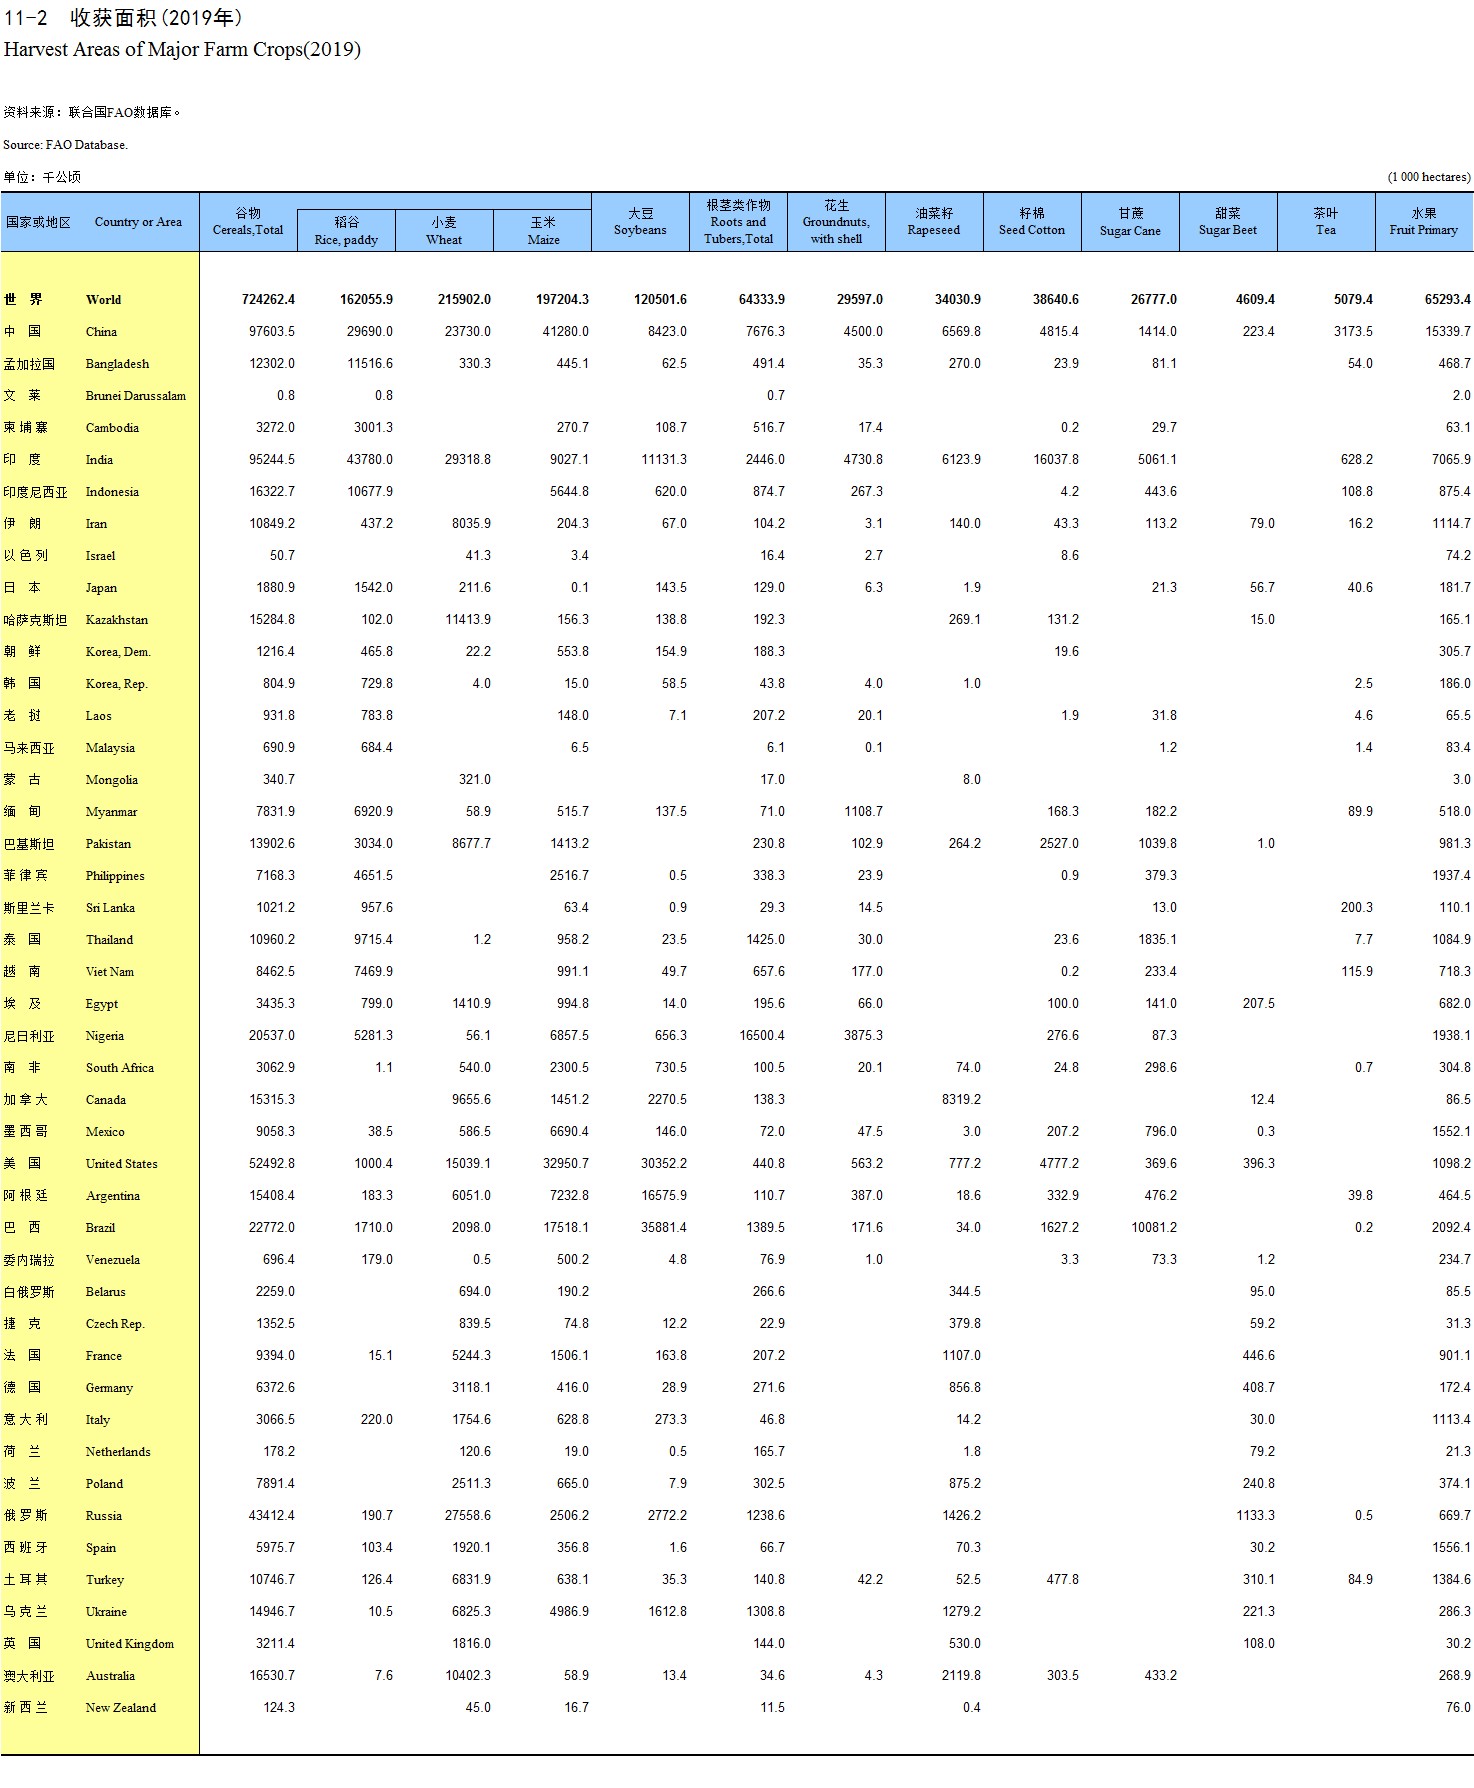
Harvest Areas of Major Farm Crops (2019)
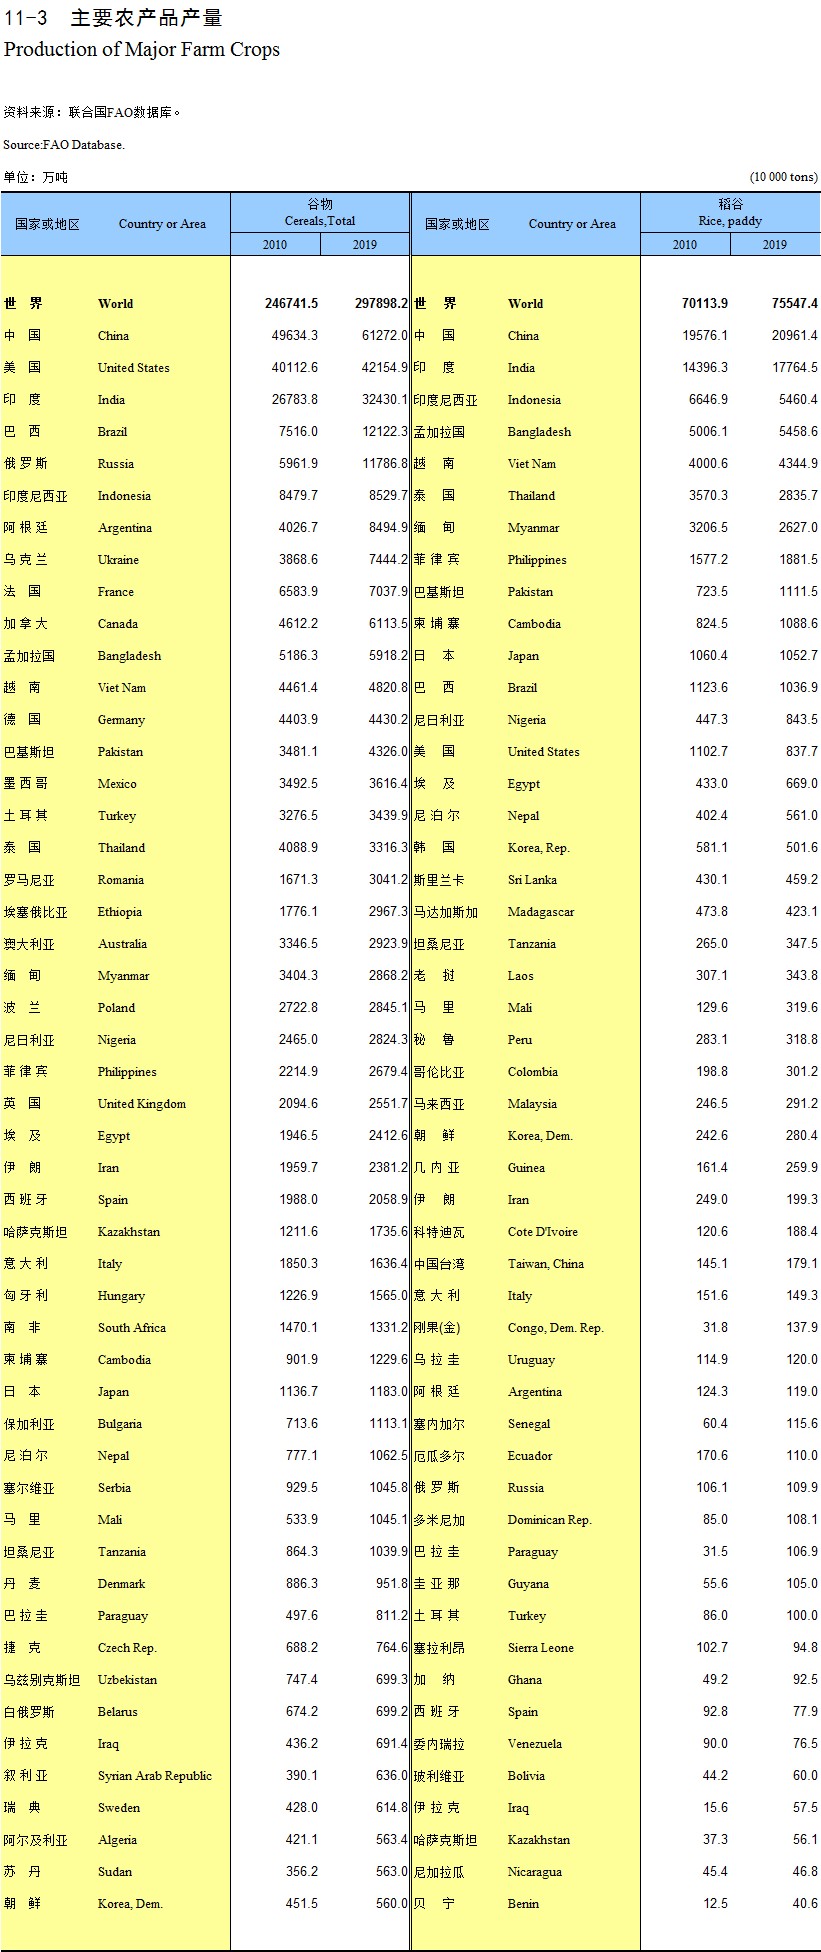
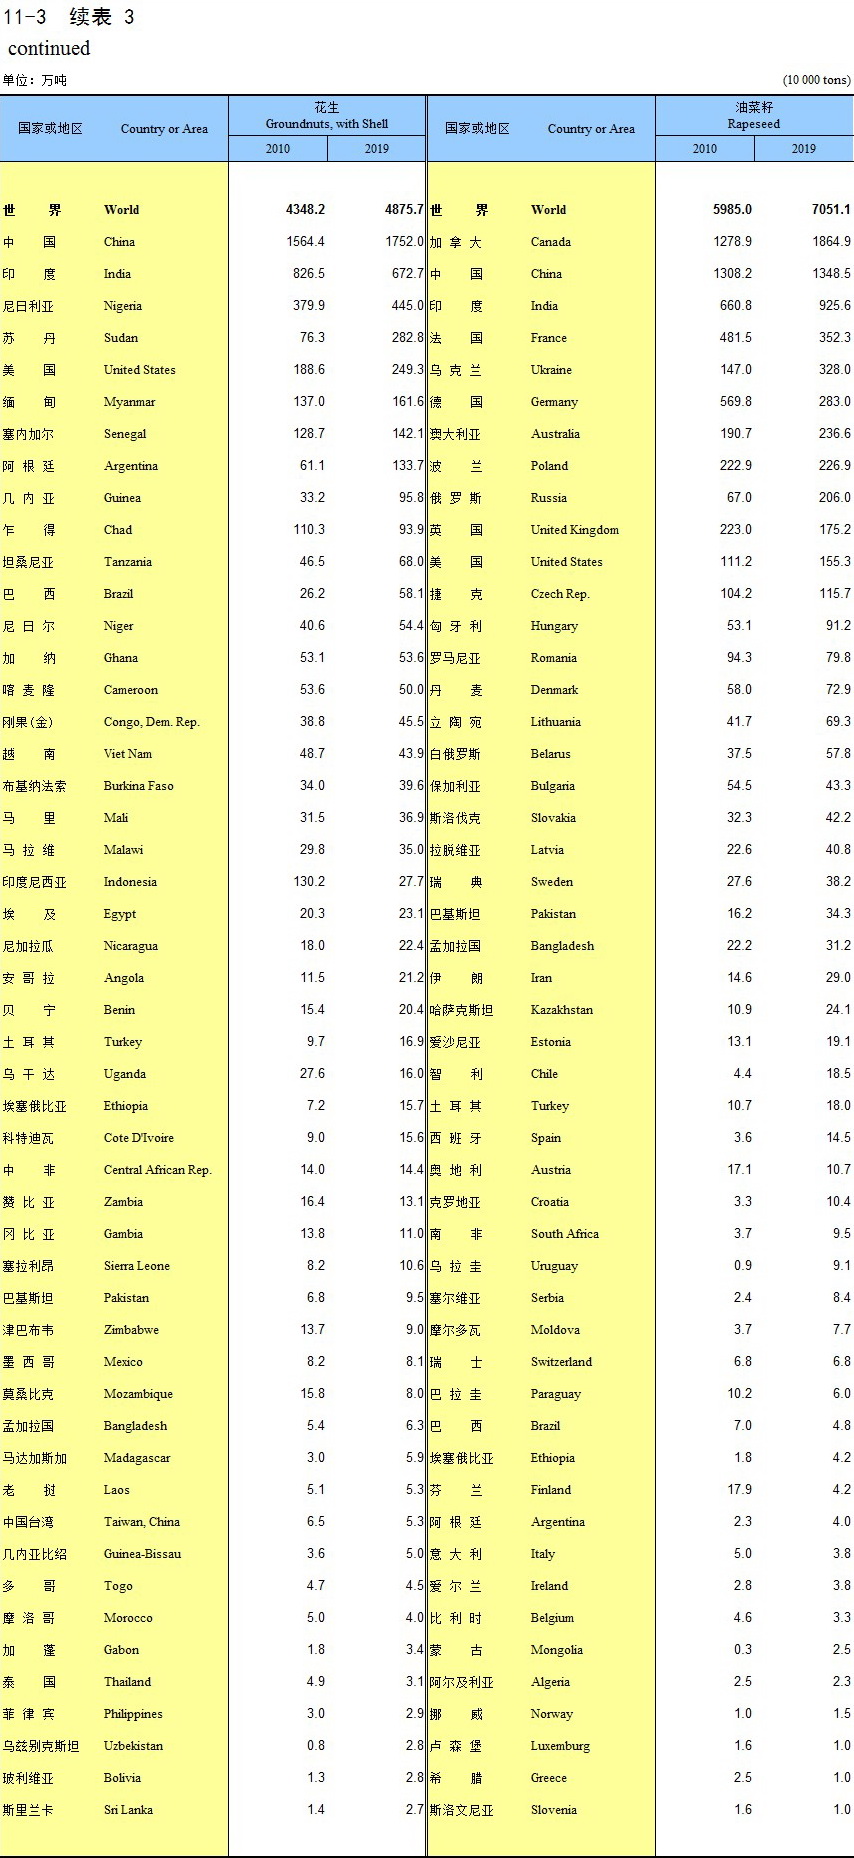
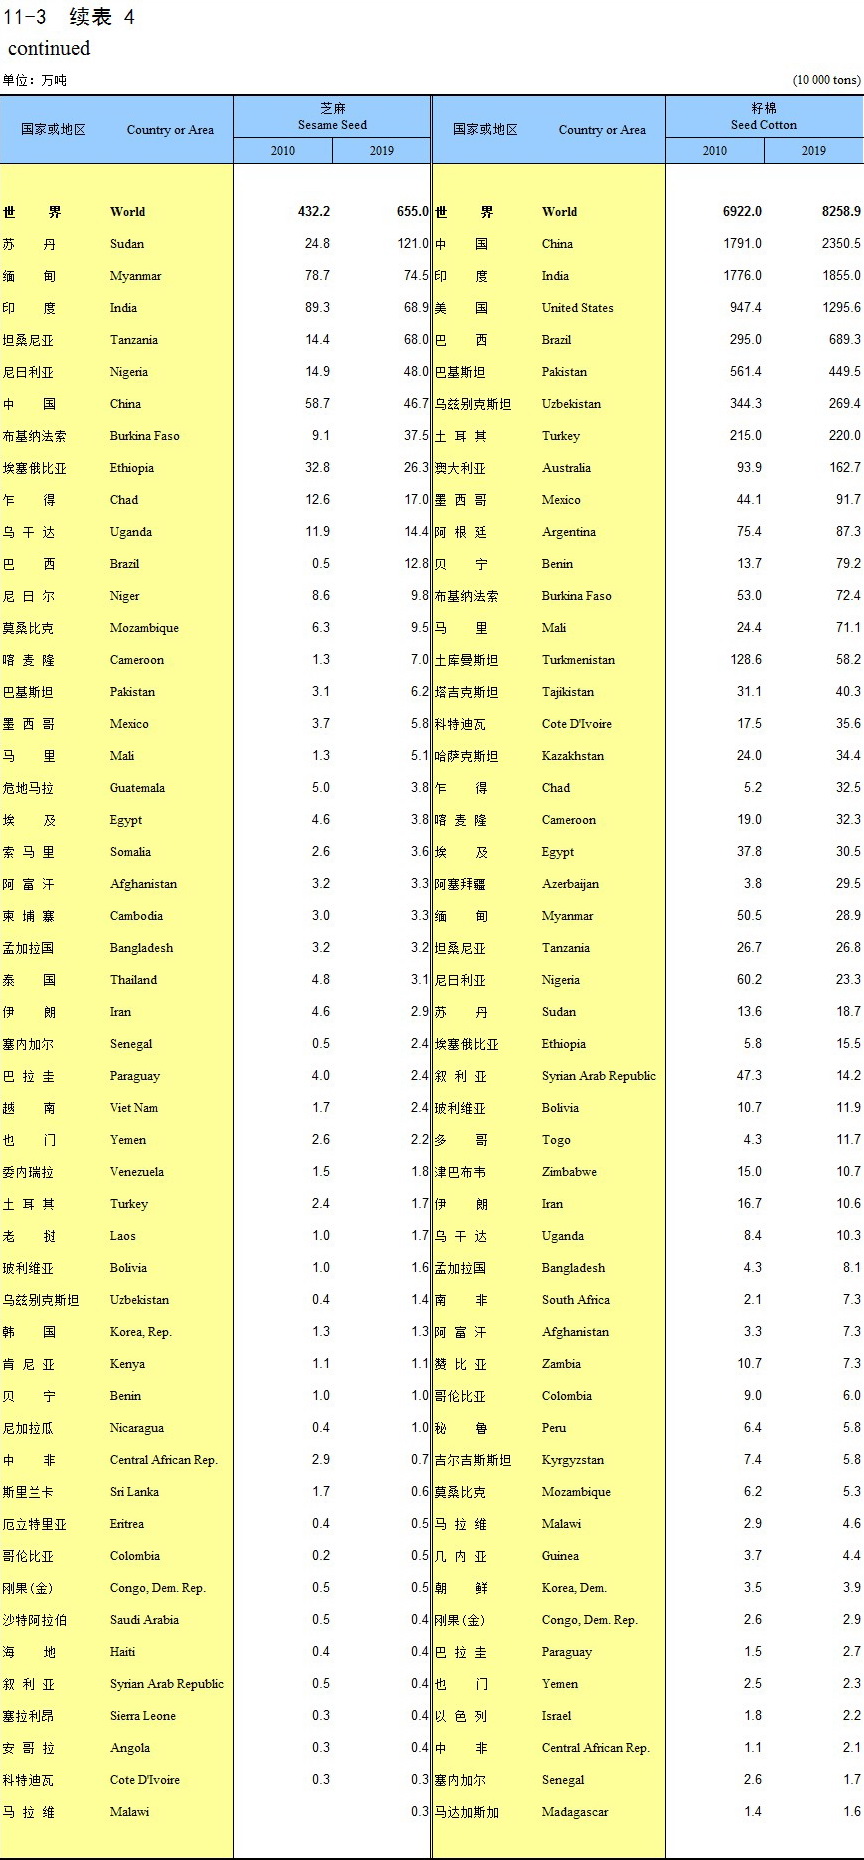
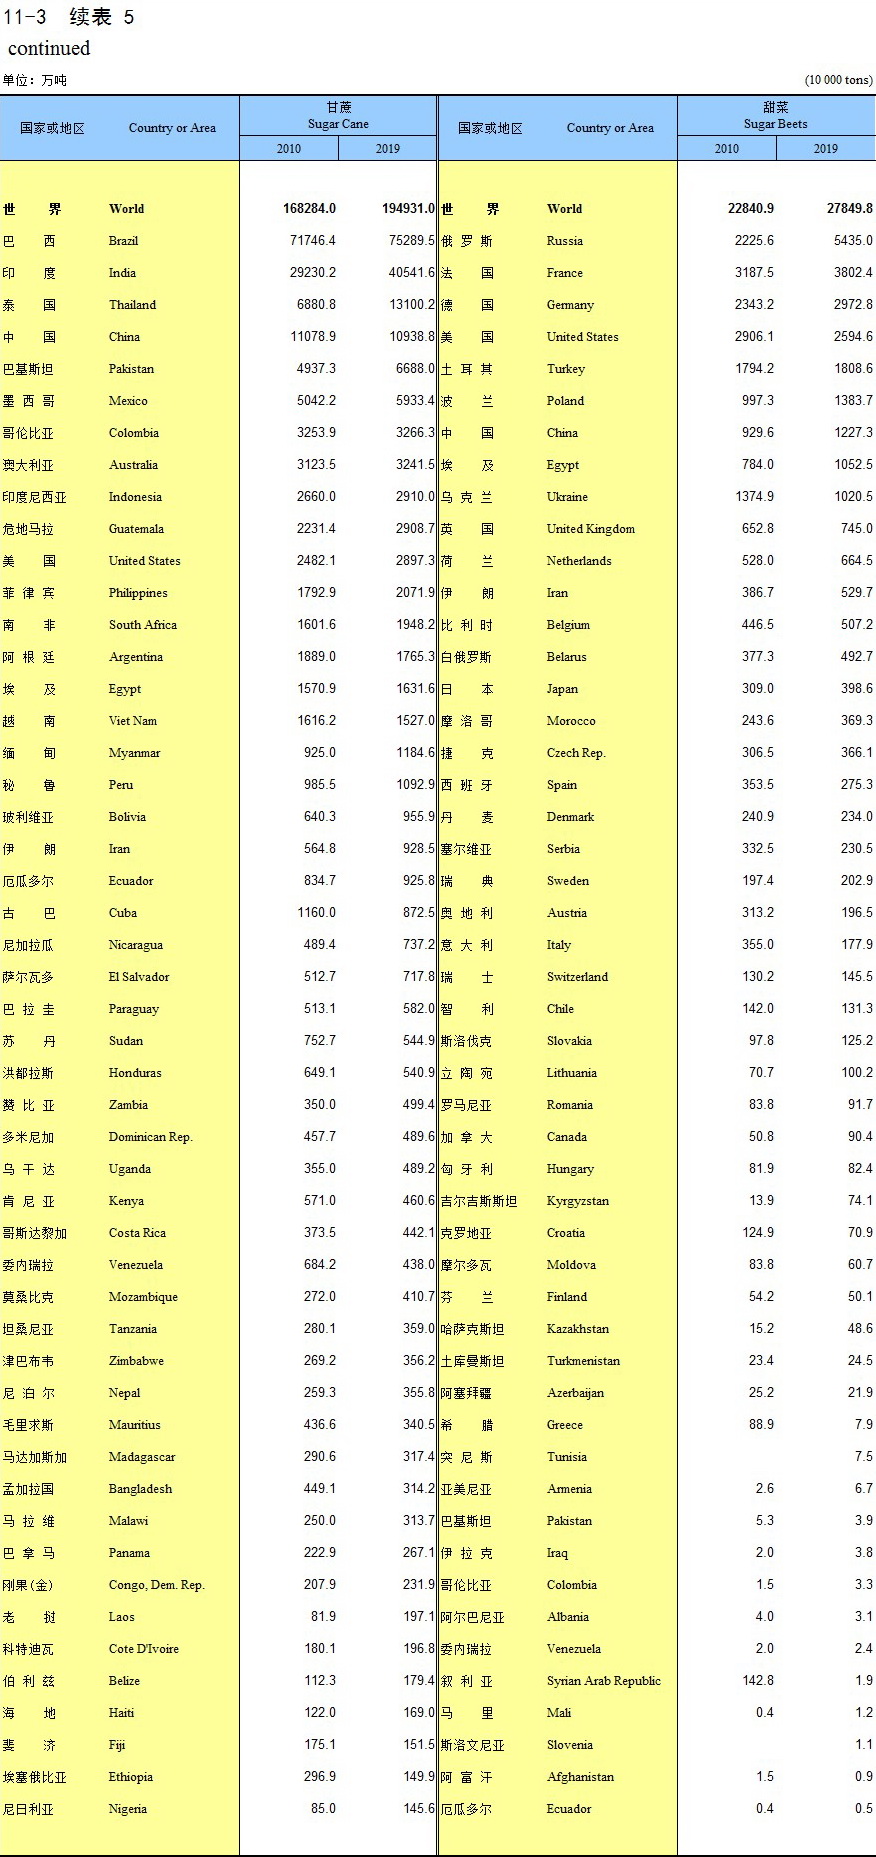
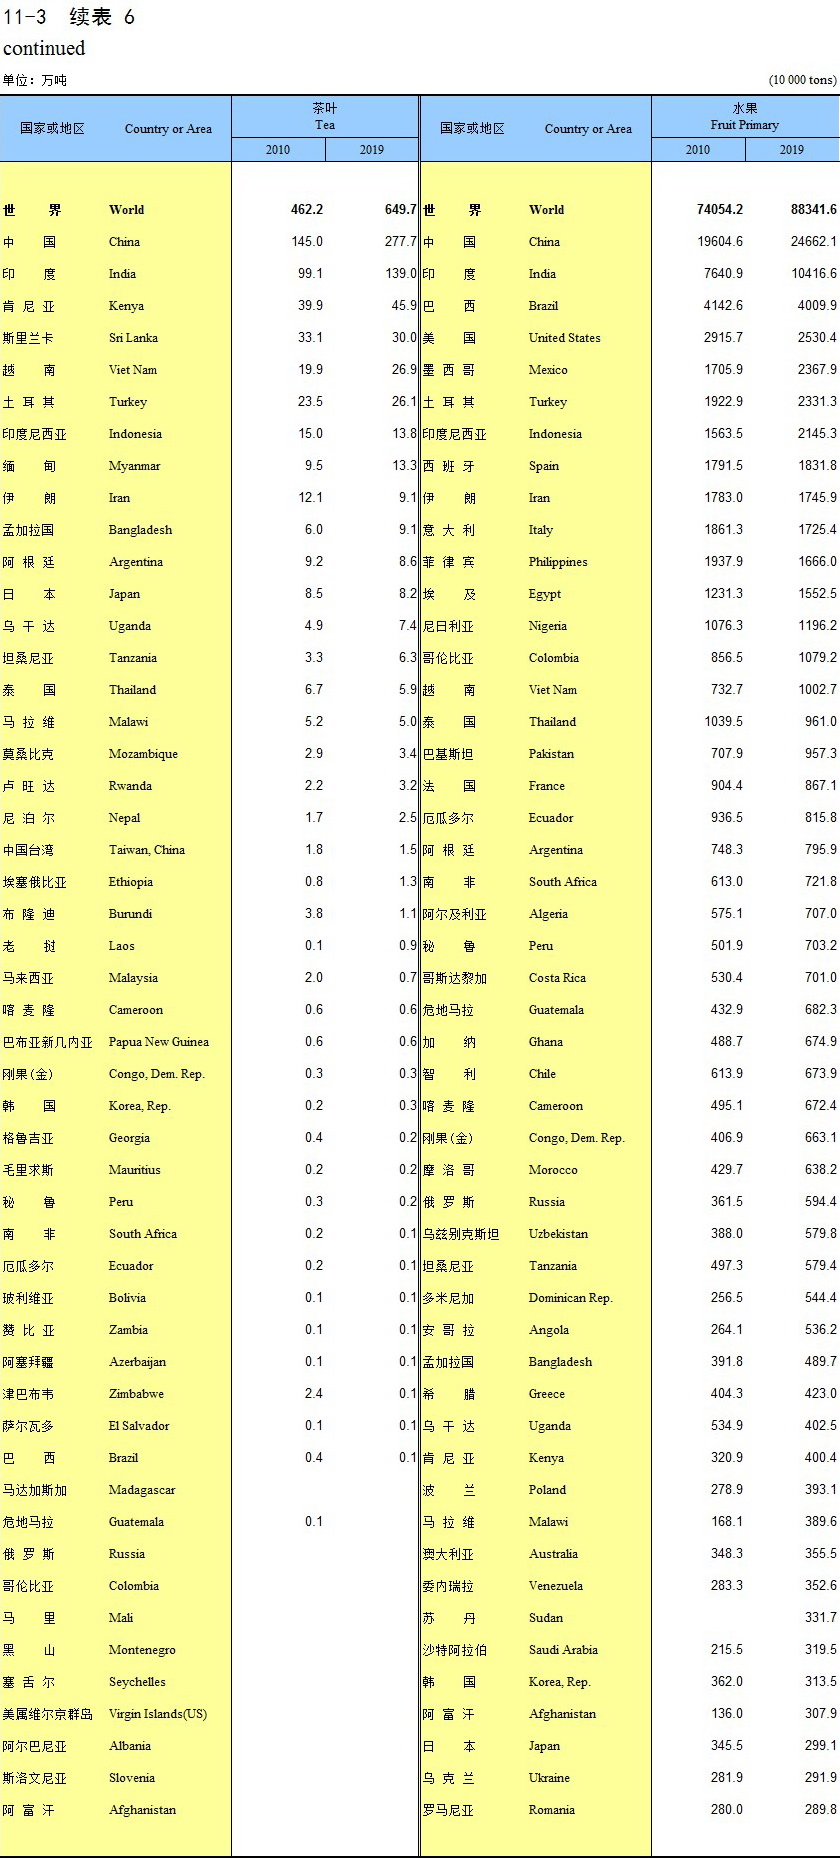
Production of Major Farm Crops
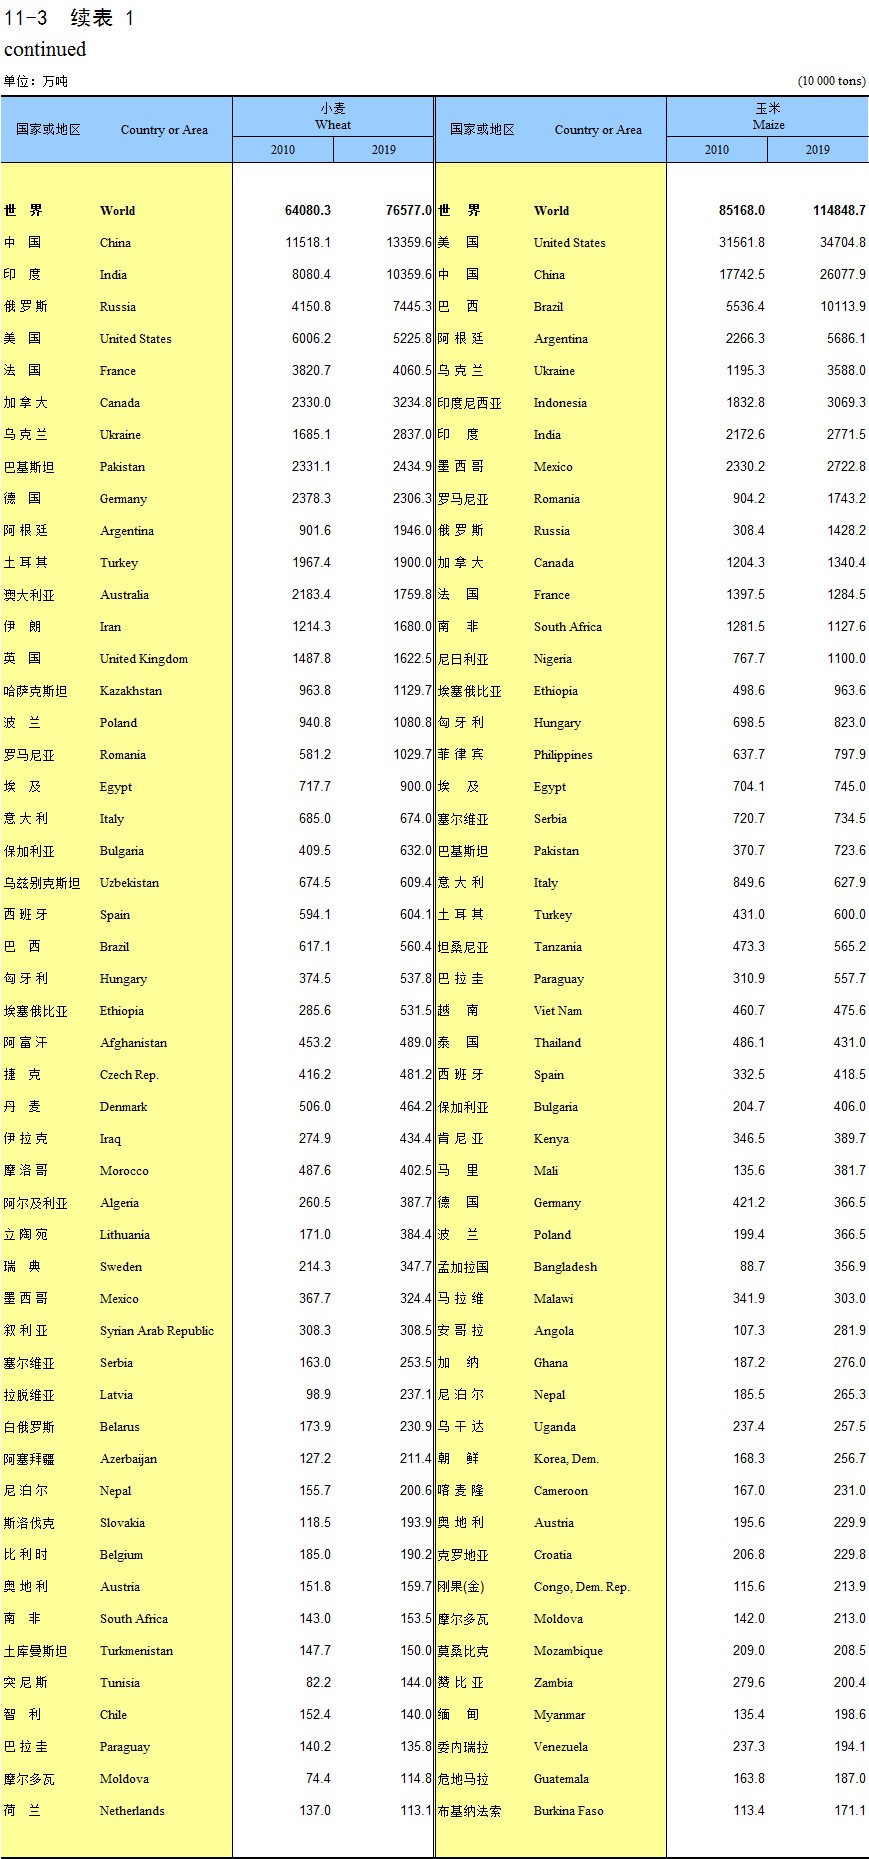
continued
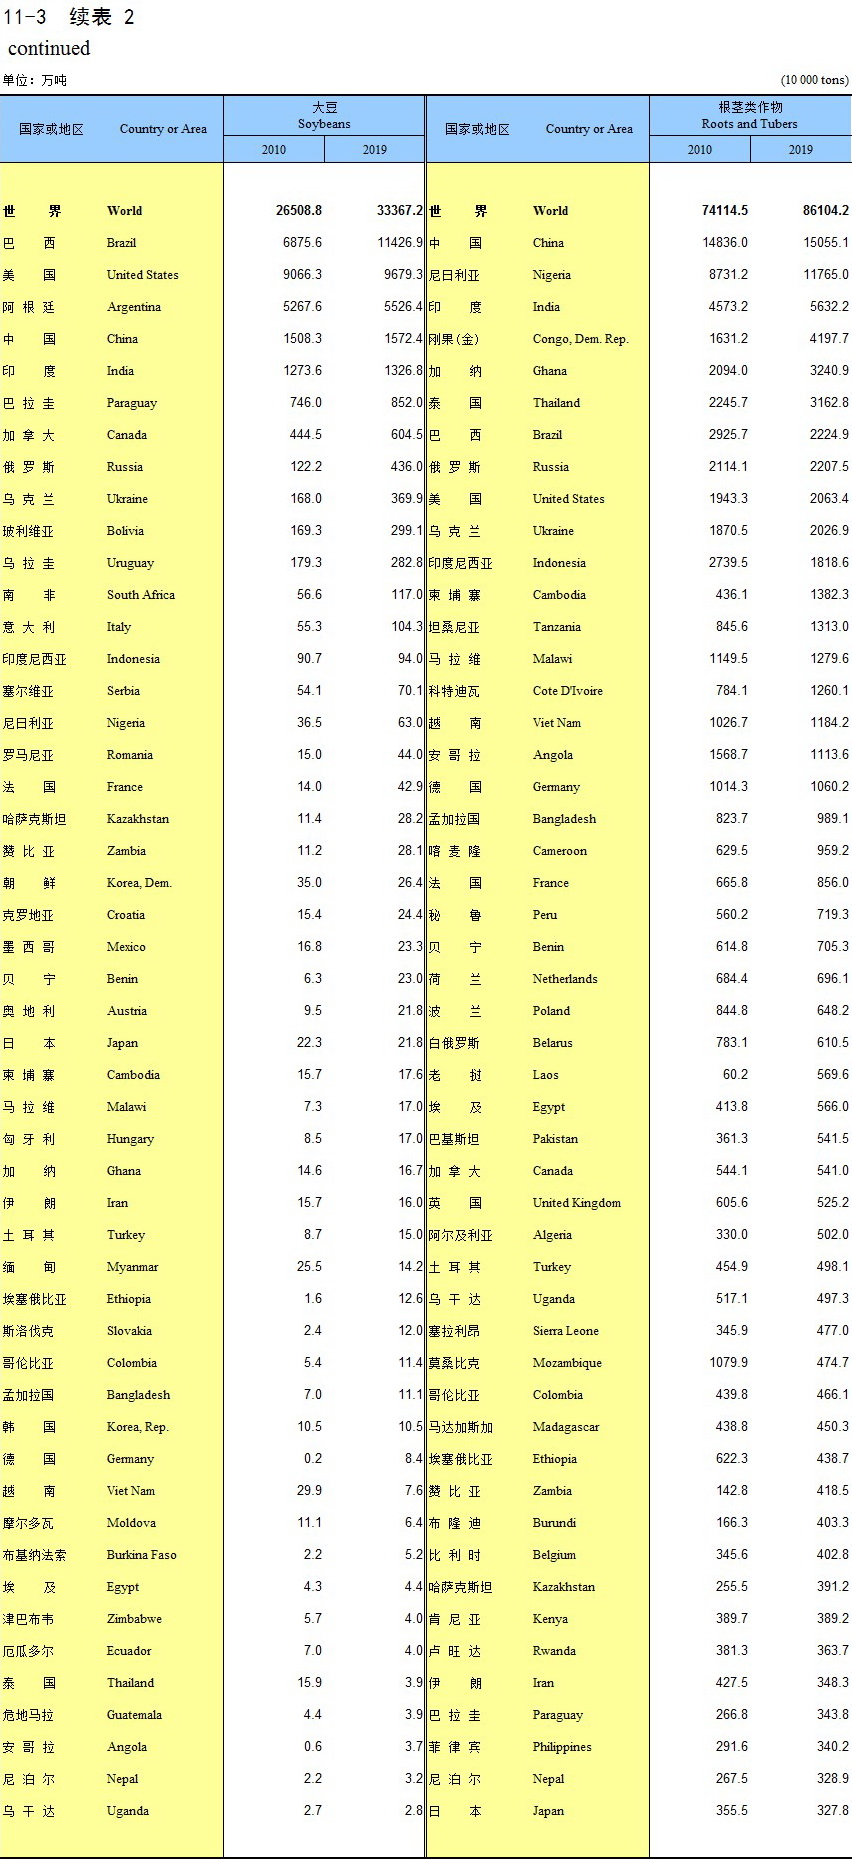
continued
continued
continued
continued
continued
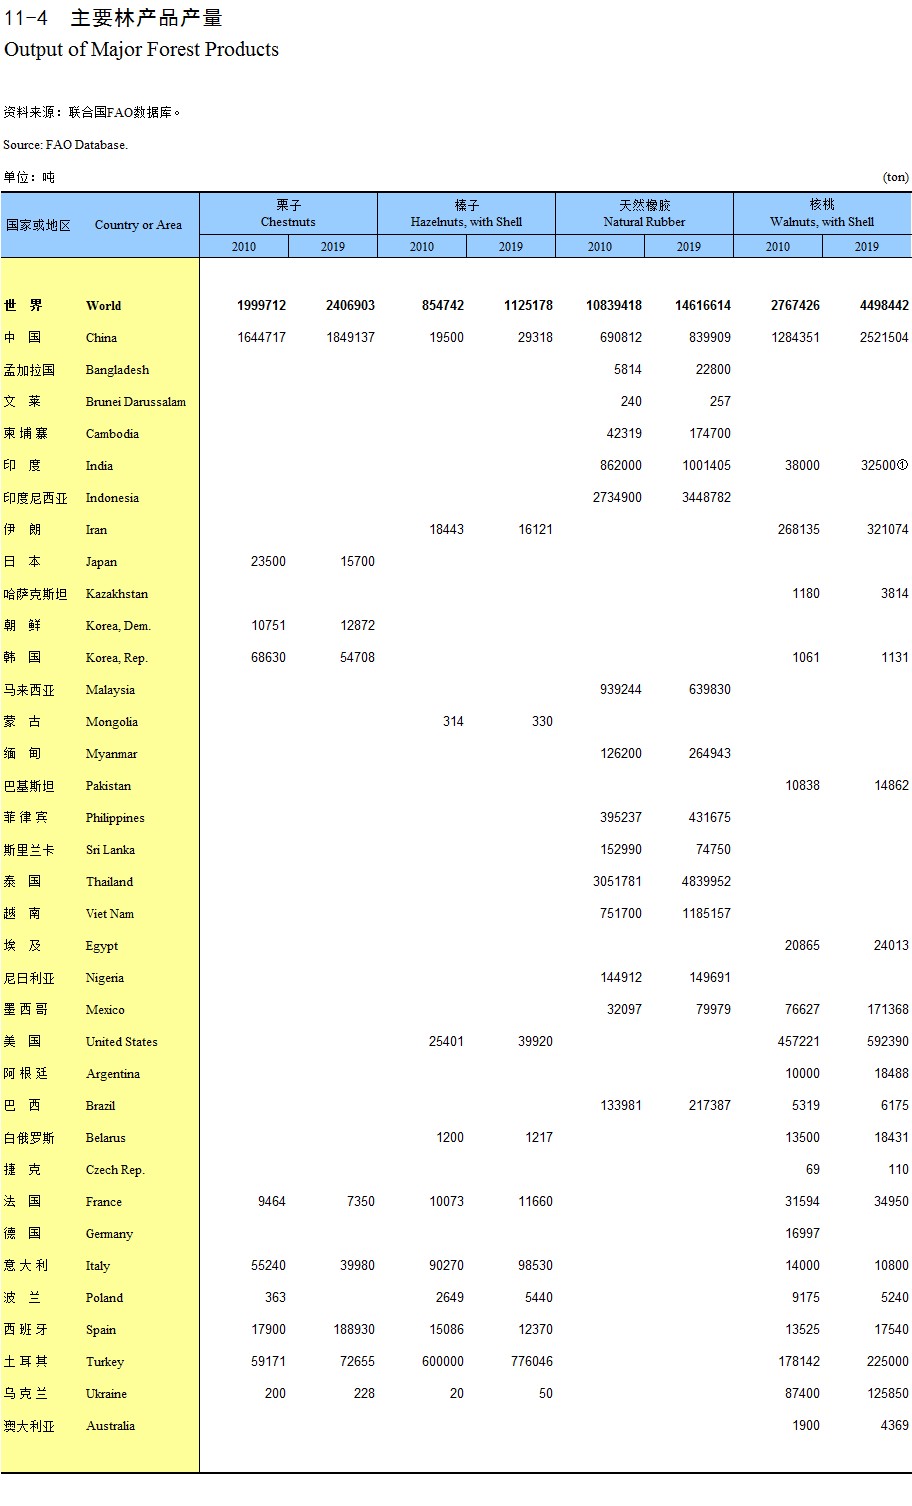
Output of Major Forest Products
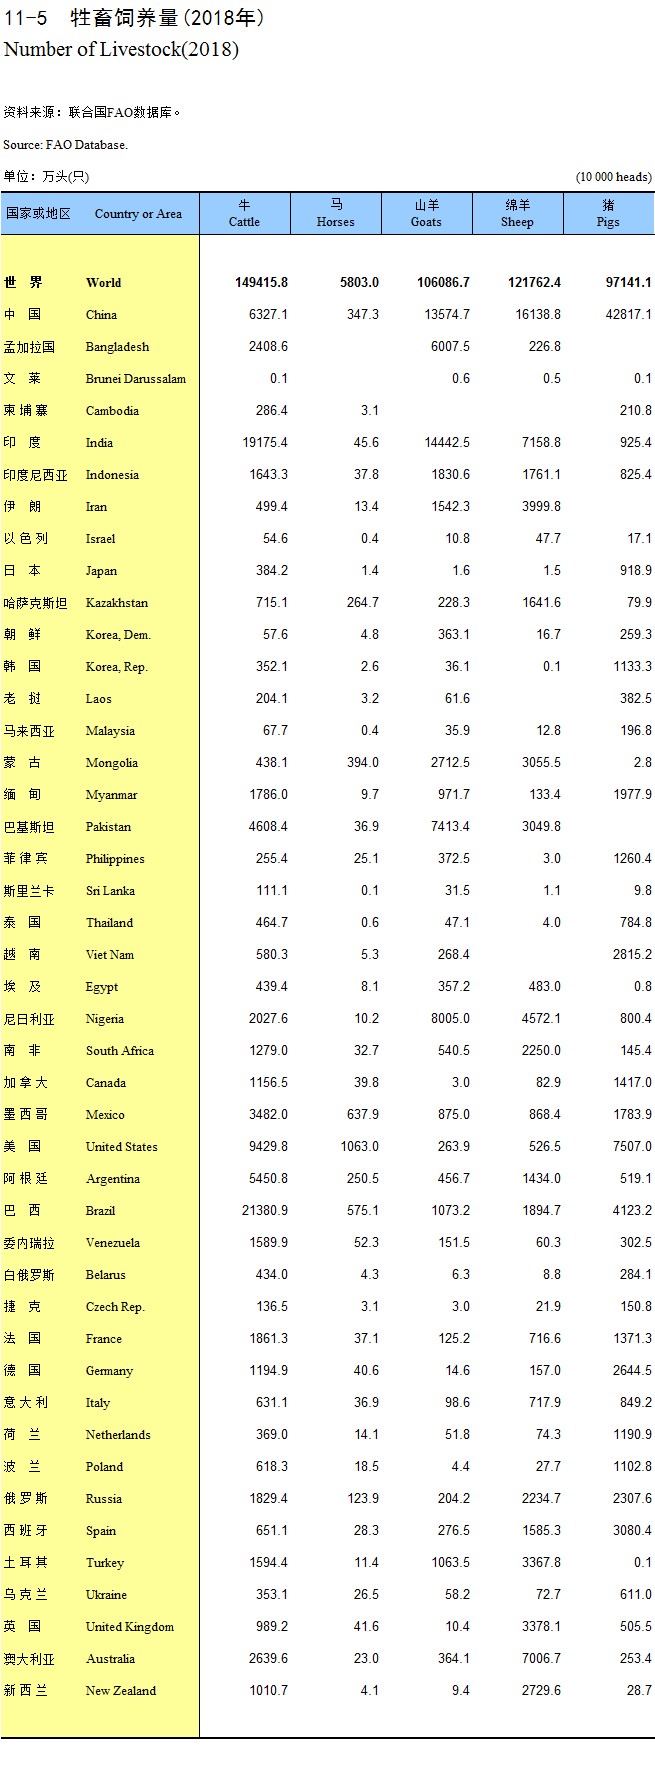
Number of Livestock (2018)
Output of Livestock Products (2018)
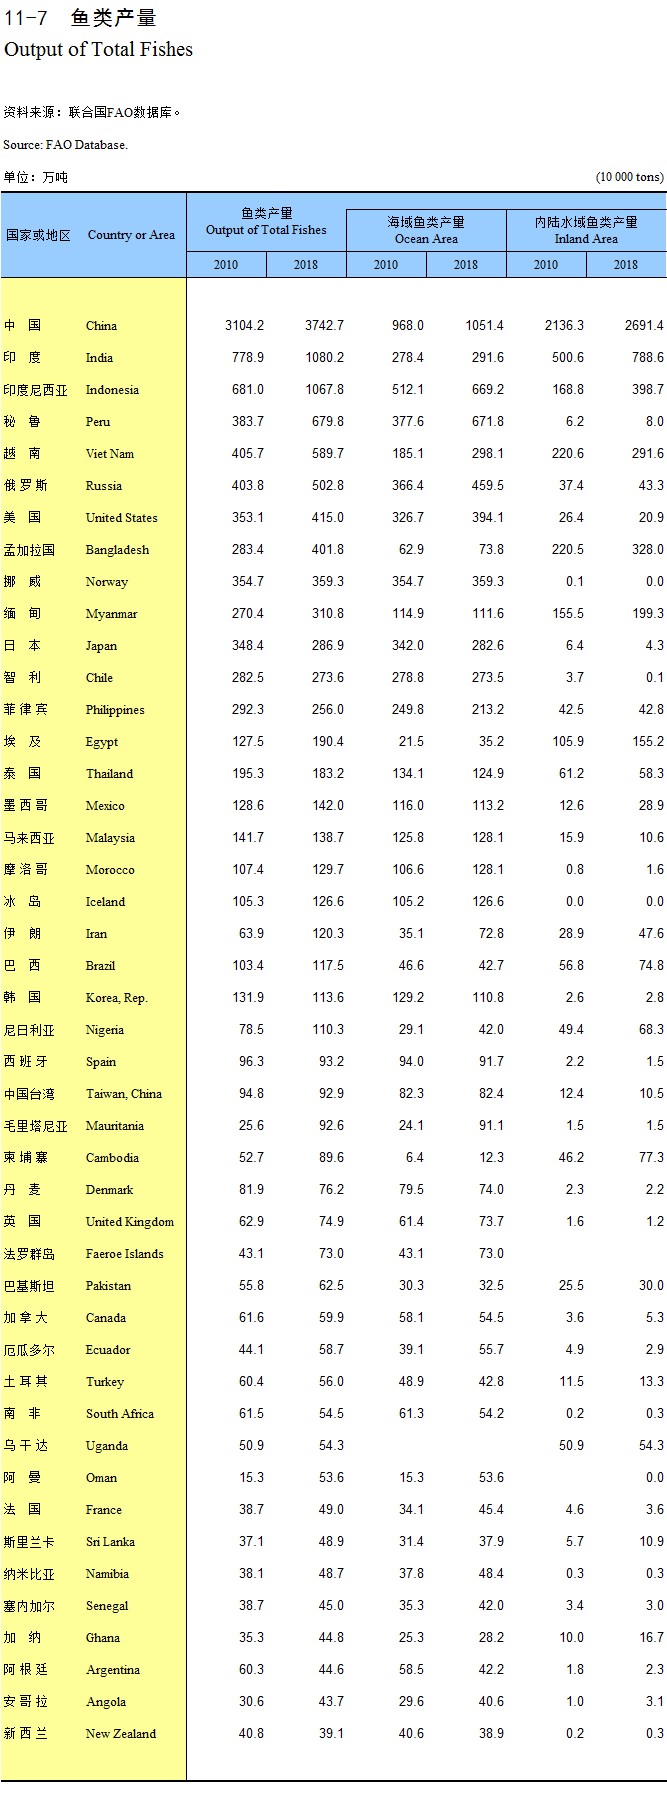
Output of Total Fishes
Consumption of Fertilizers (2018)
Explanatory Notes on Main Statistical Indicators
Industry and Construction
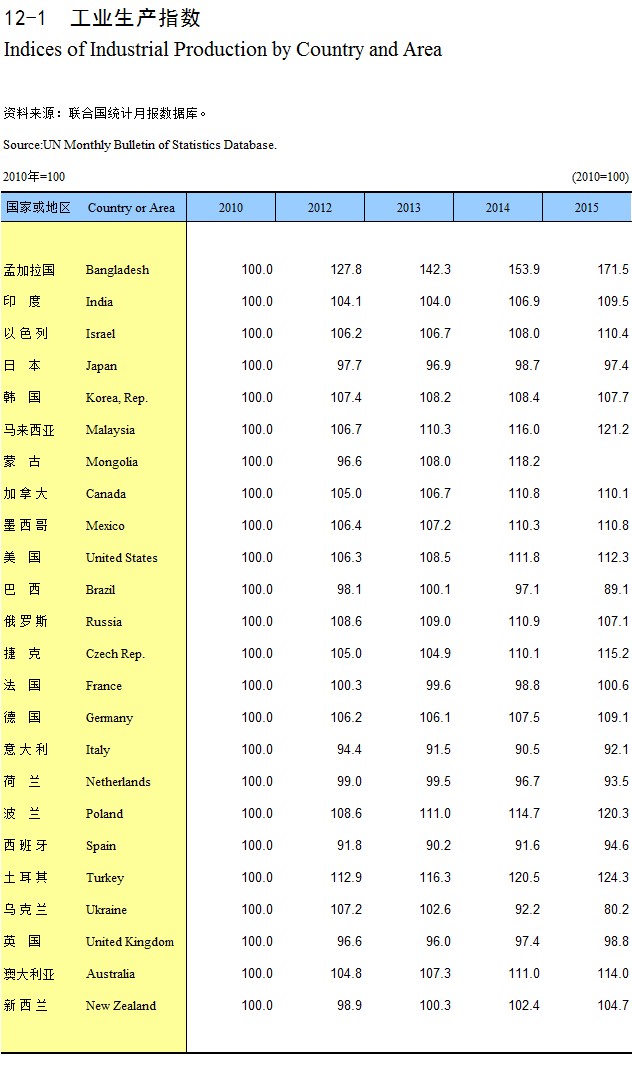
Indices of Industrial Production by Country and Area
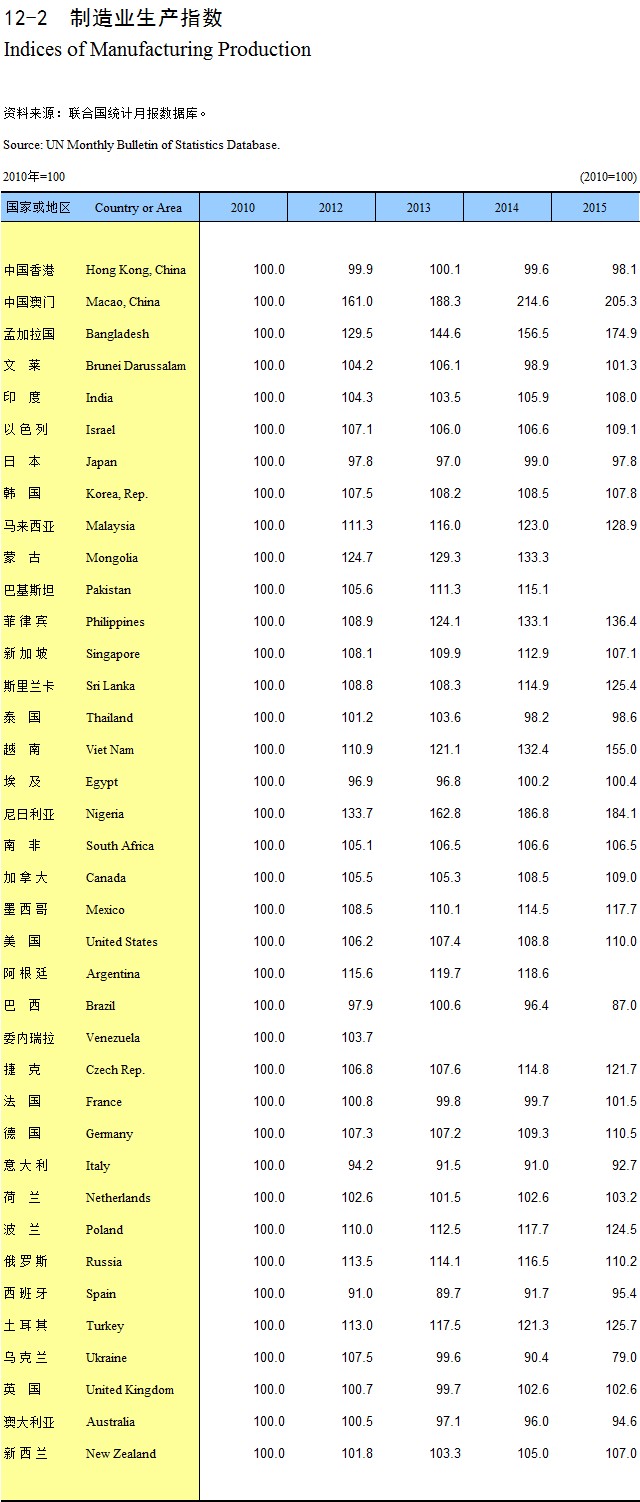
Indices of Manufacturing Production
Indices of Mining Production
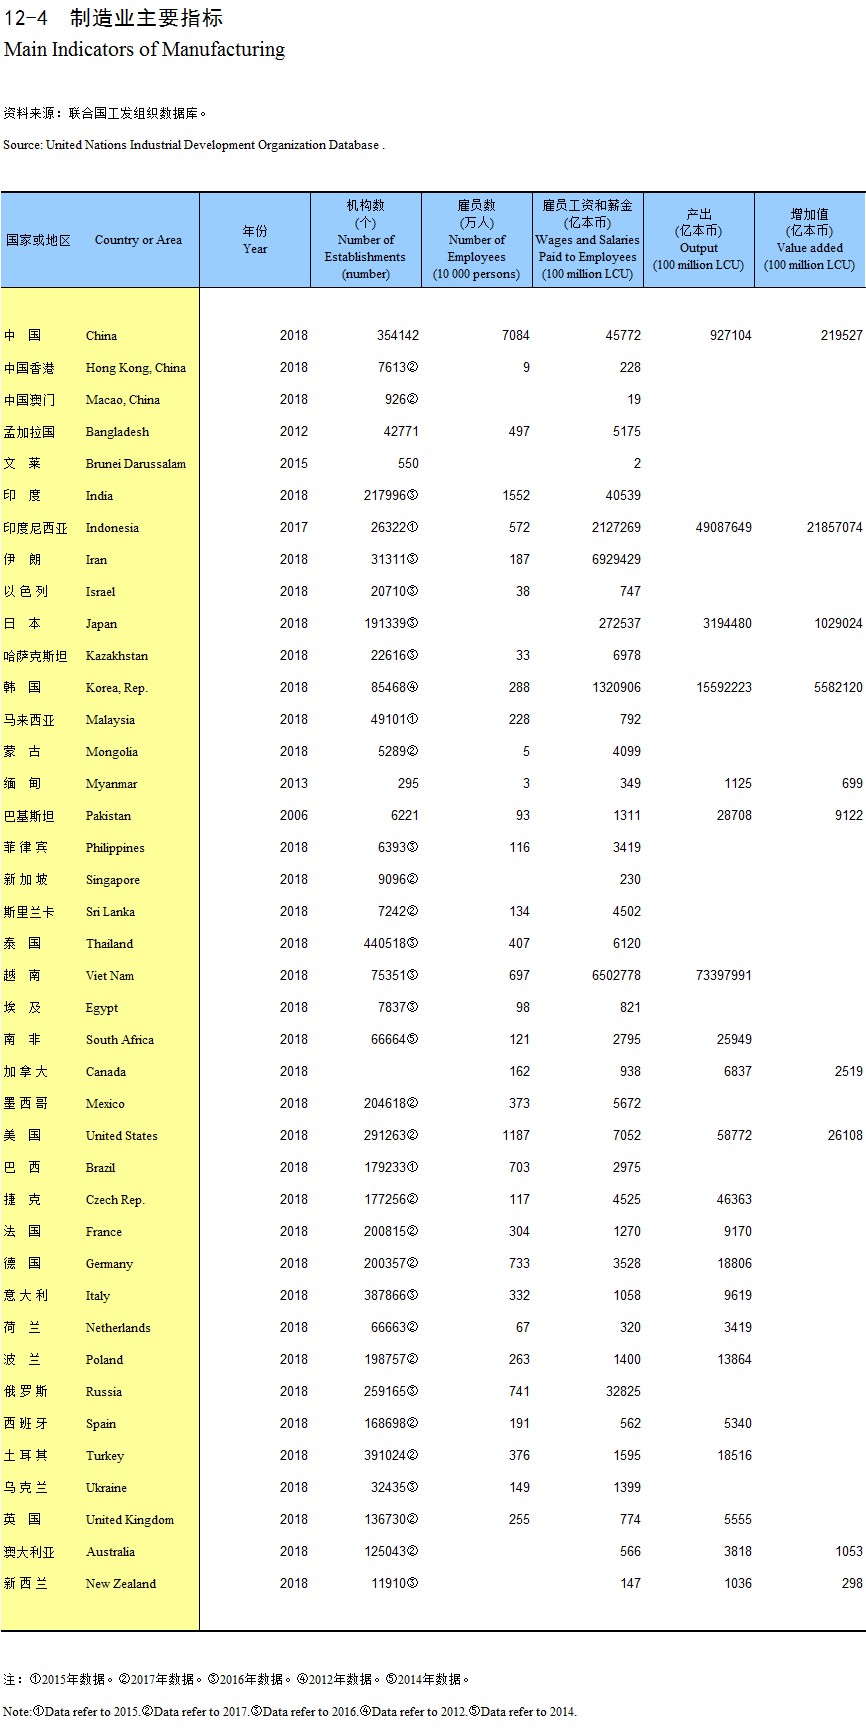
Main Indicators of Manufacturing
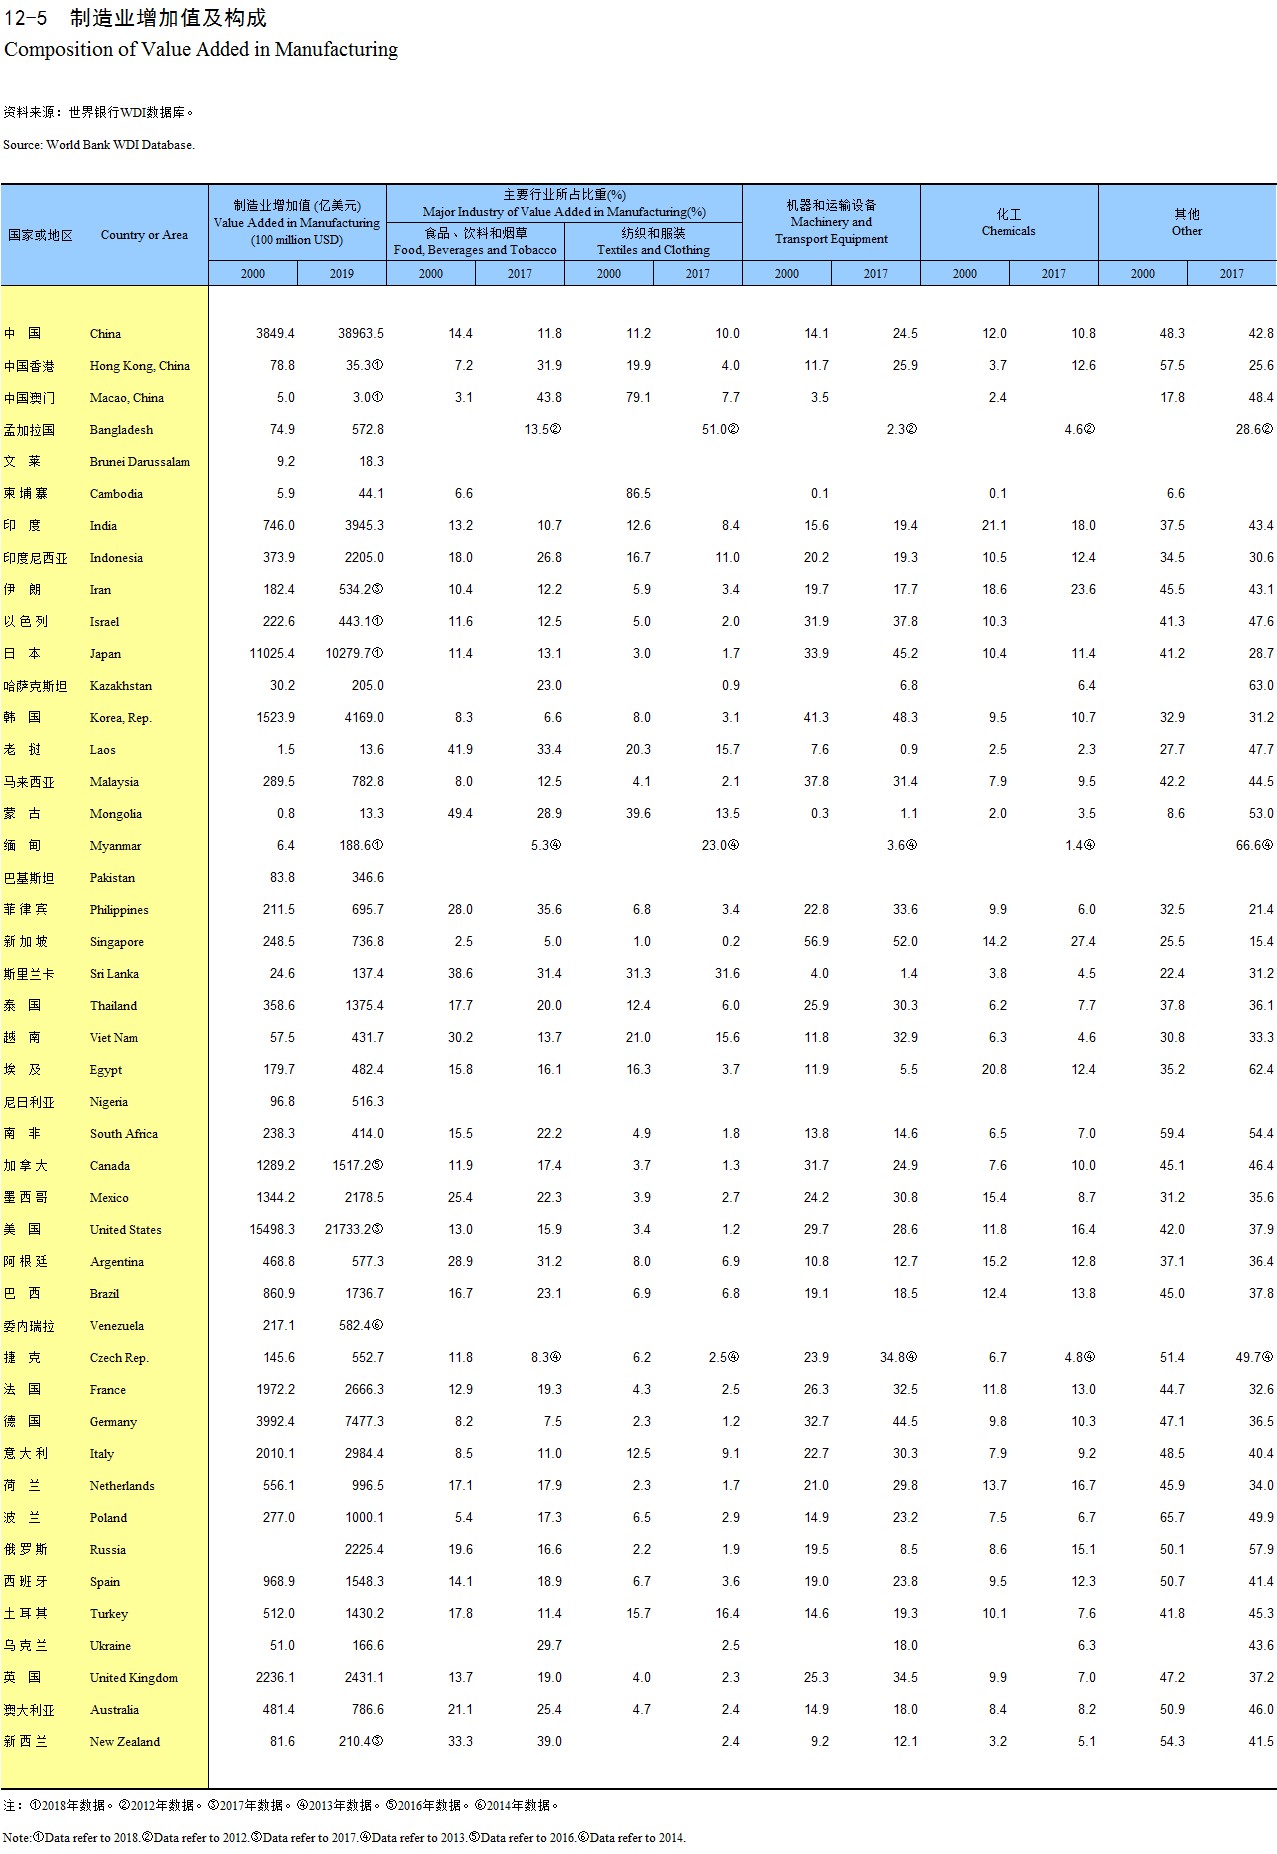
Composition of Value Added in Manufacturing
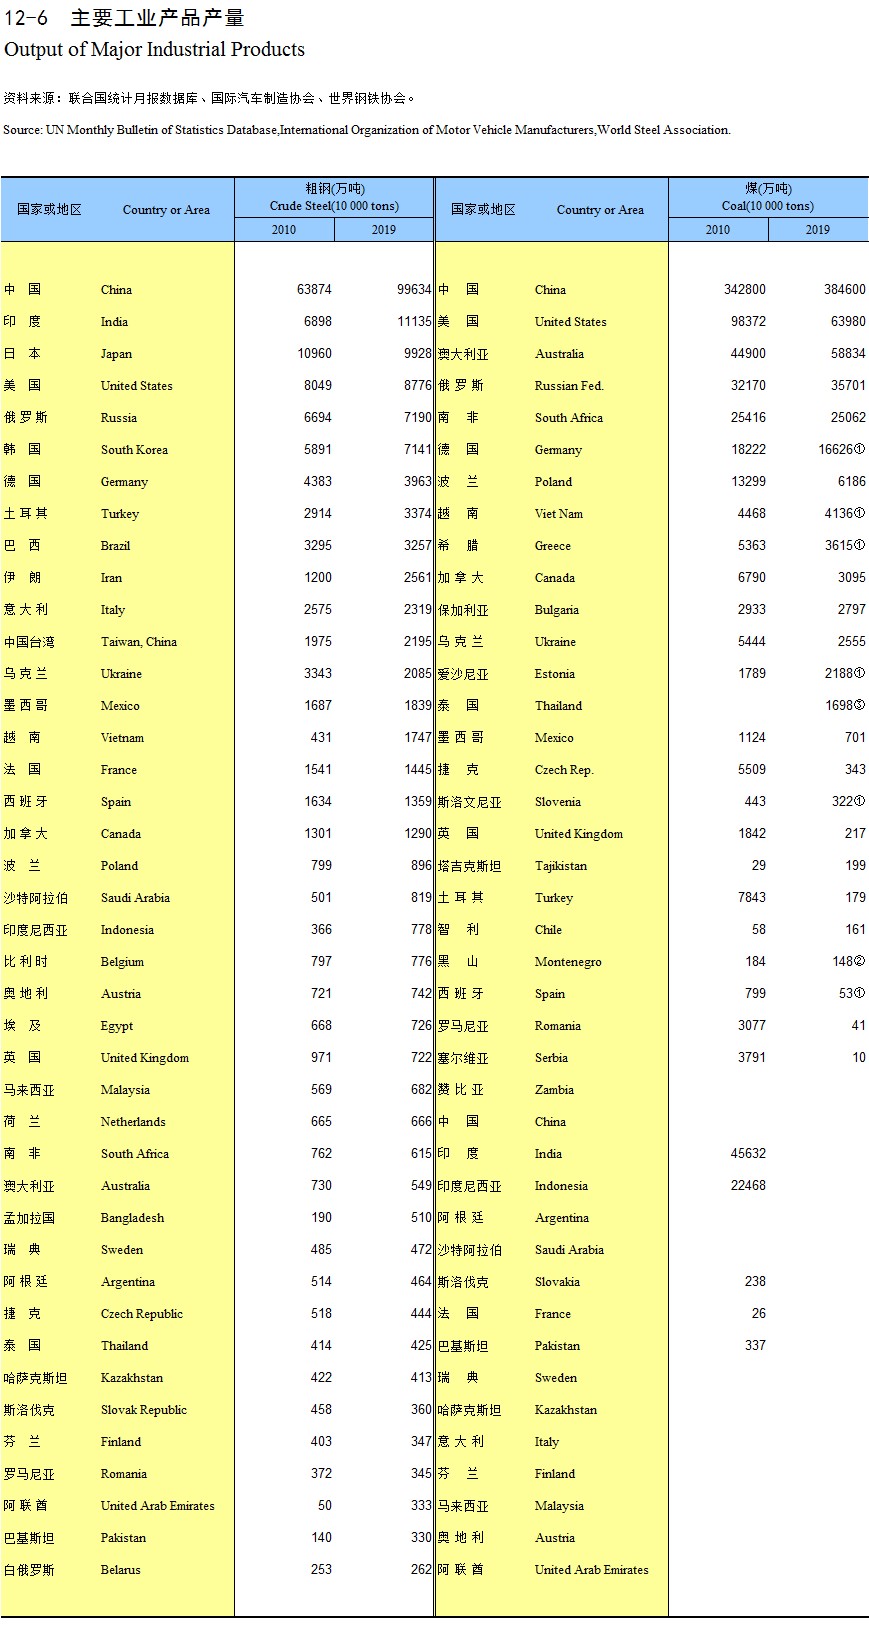
Output of Major Industrial Products
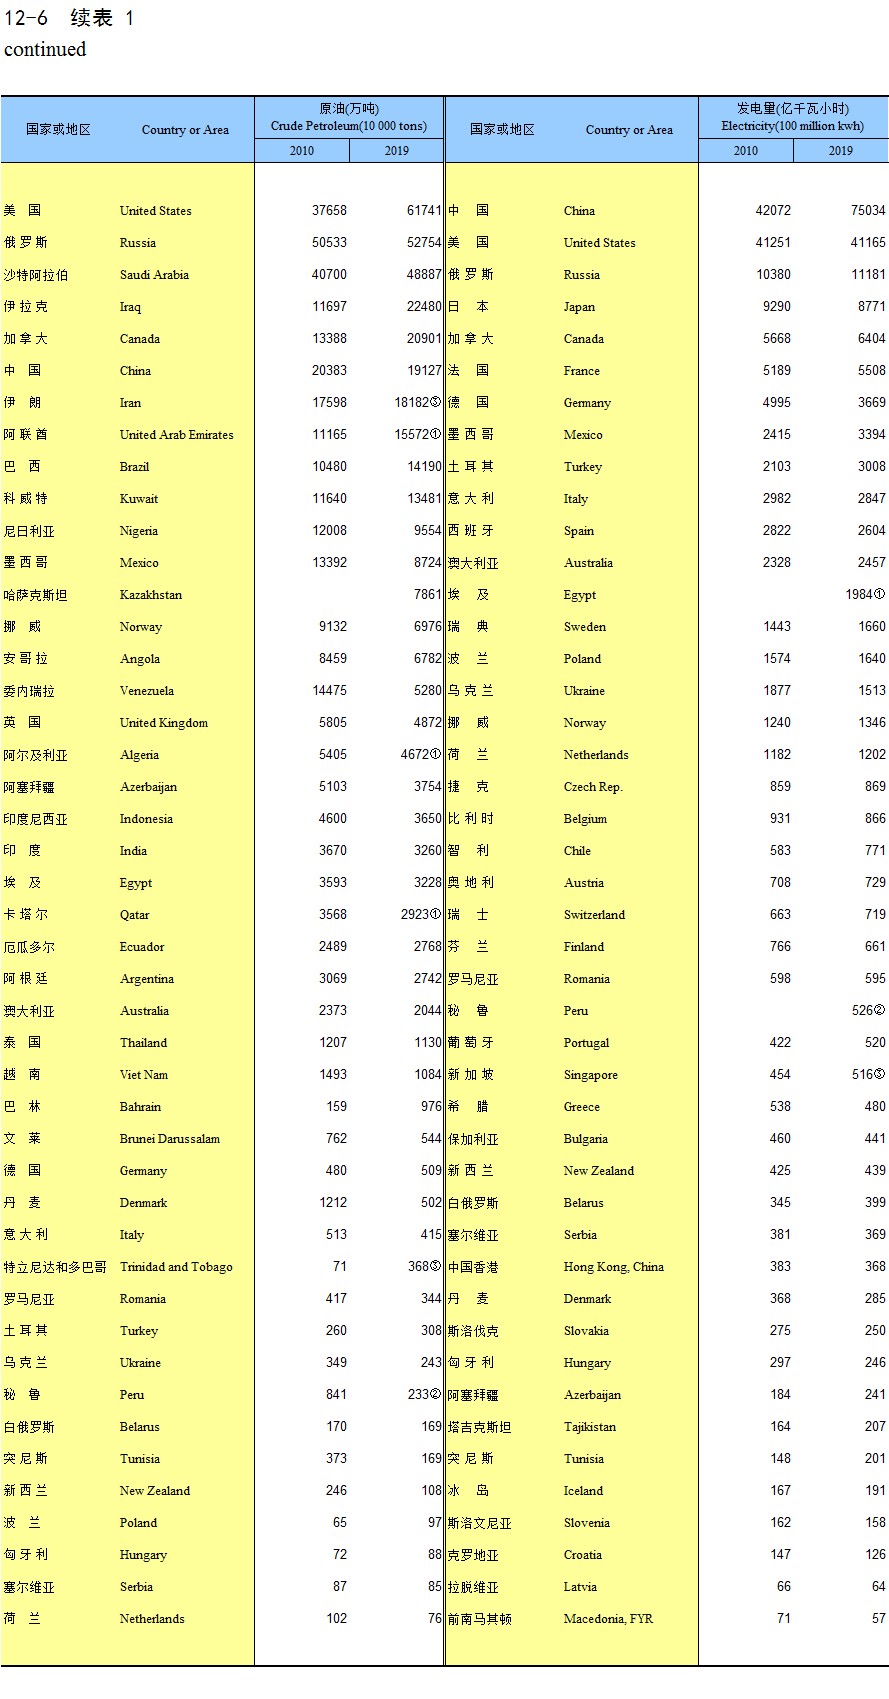
continued
continued
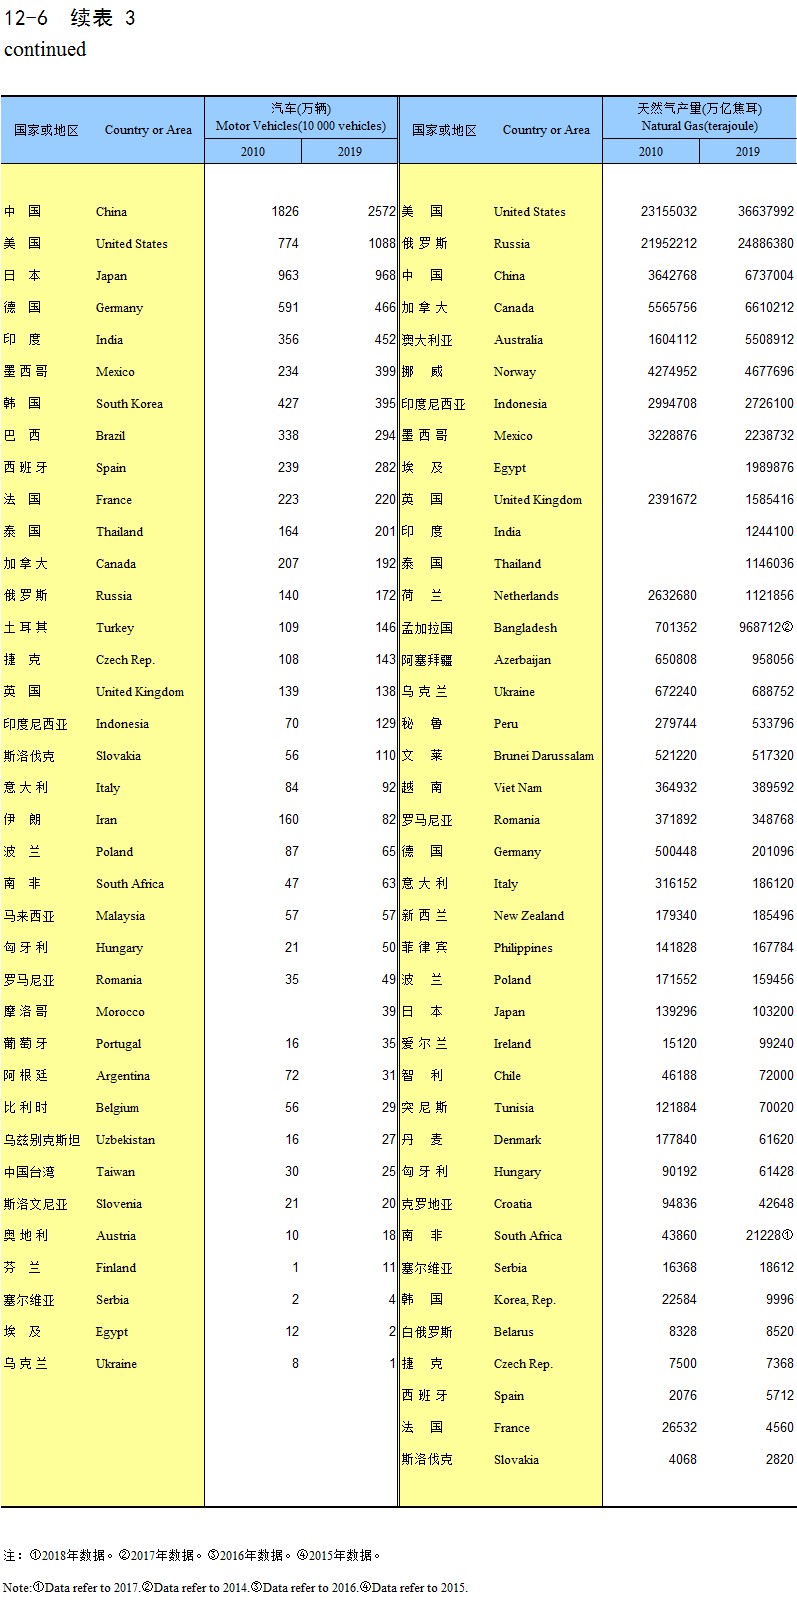
continued
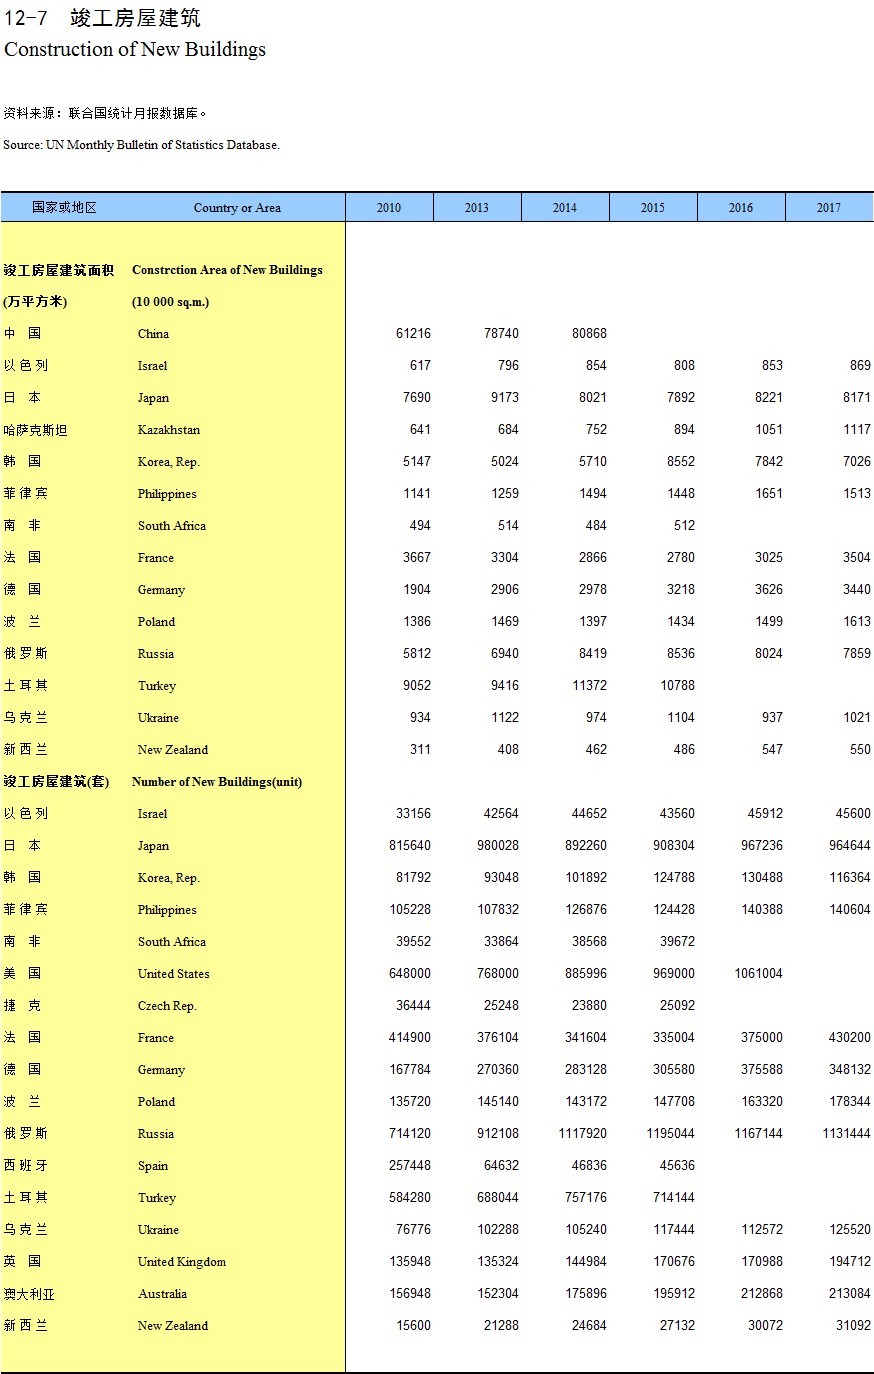
Construction of New Buildings
Explanatory Notes on Main Statistical Indicators
Transportation and Communication
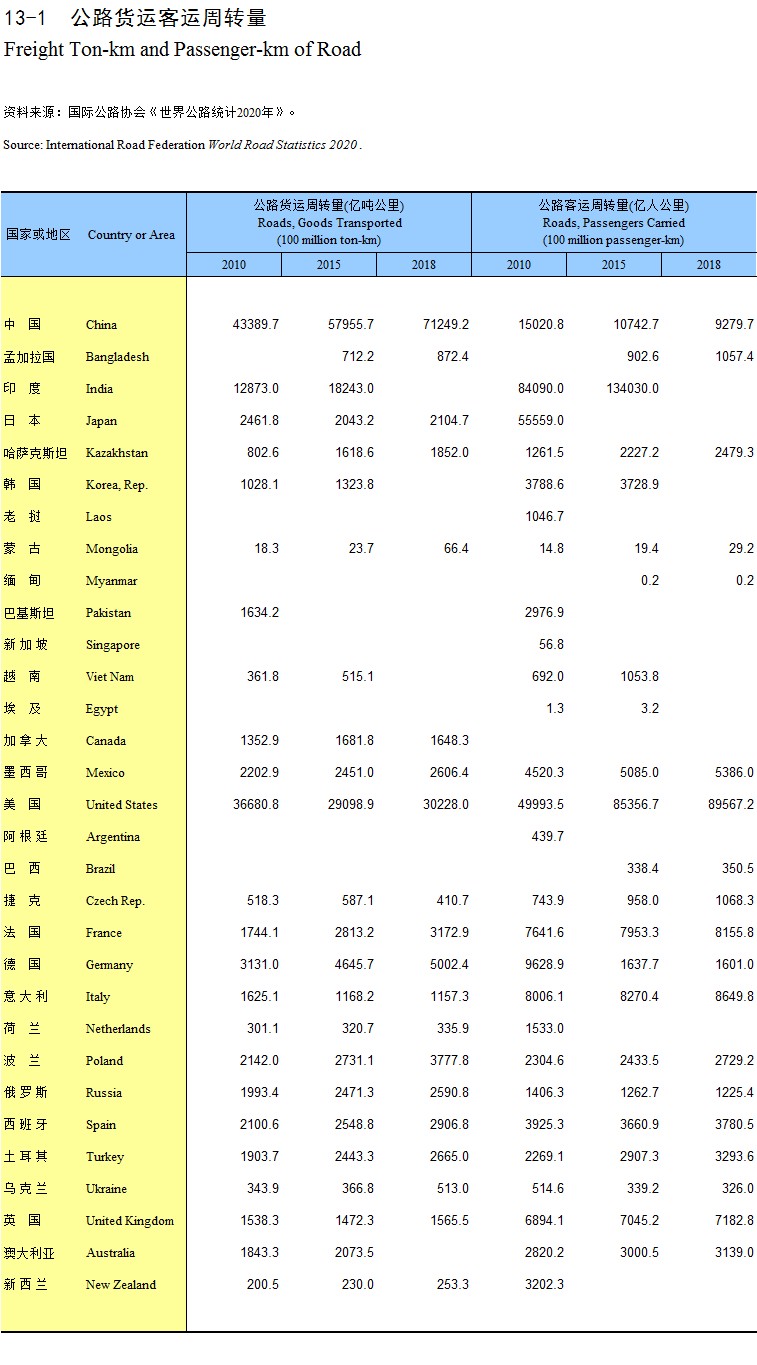
Freight Ton-km and Passenger-km of Road
Railway Traffic
International Maritime Freight Loaded and Unloaded
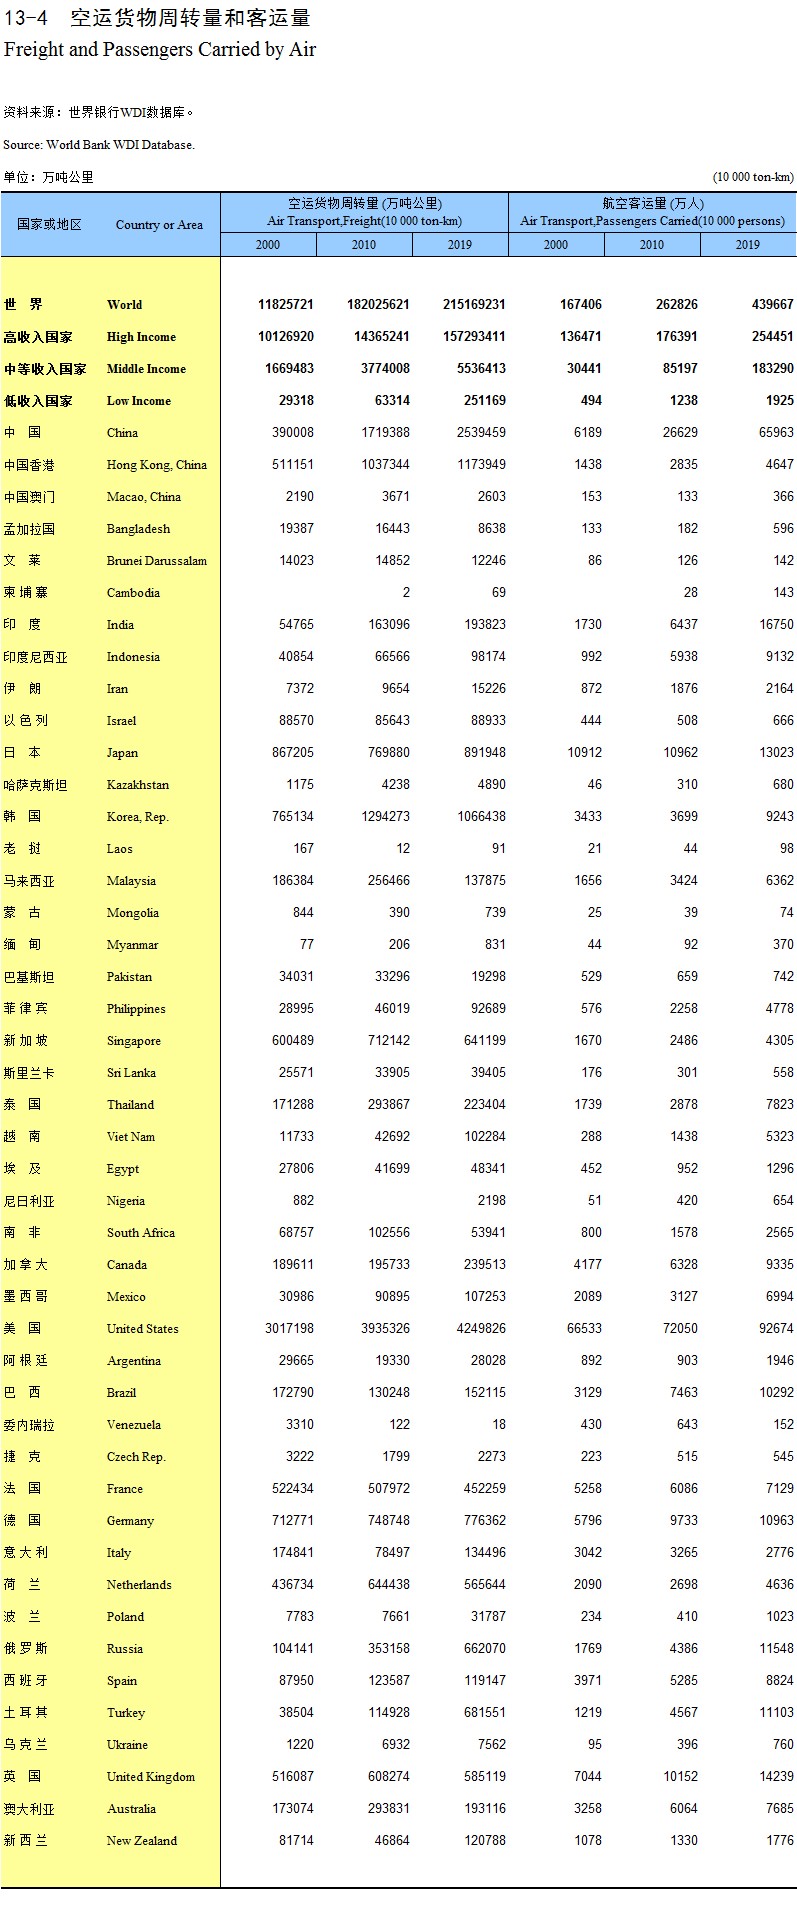
Freight and Passengers Carried by Air
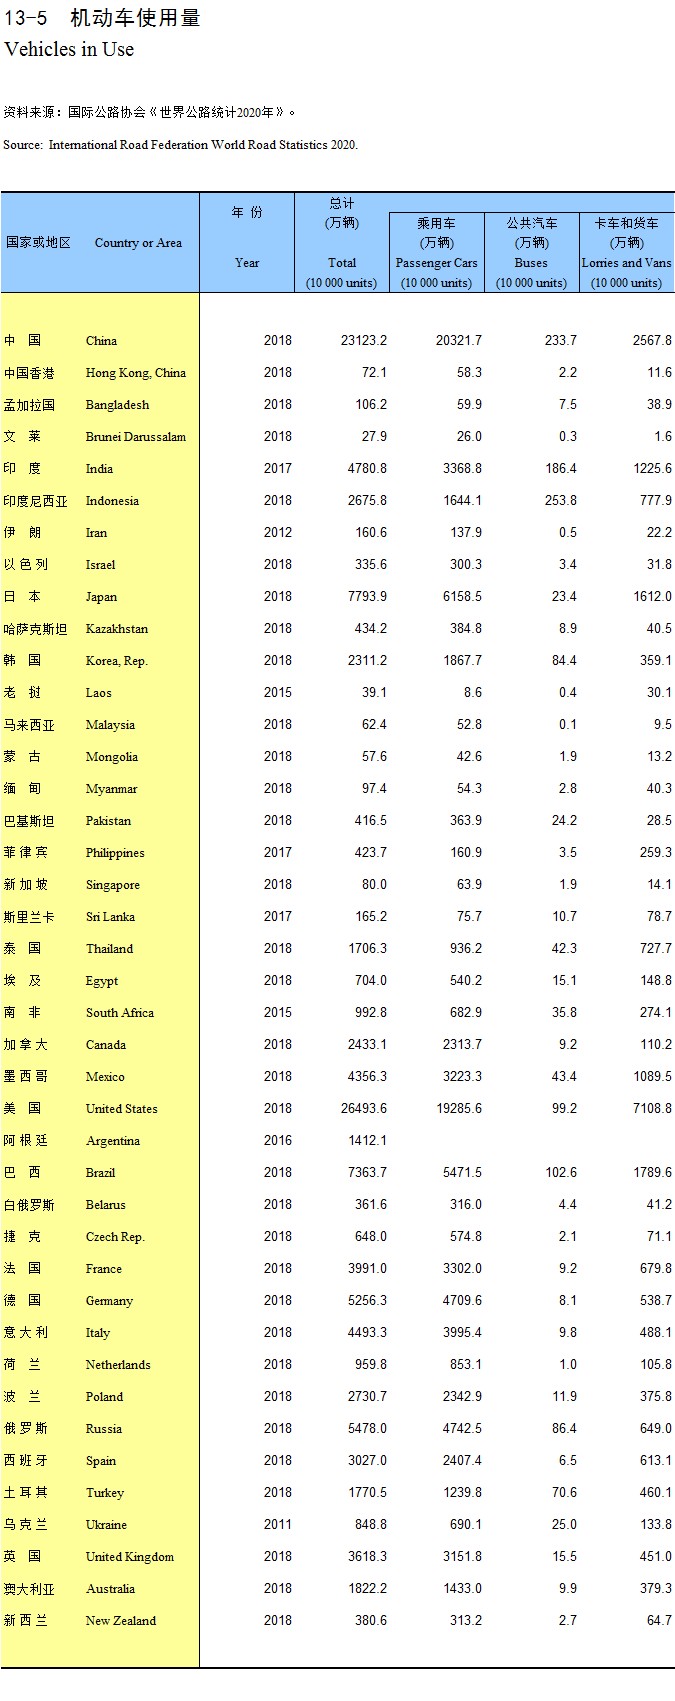
Vehicles in Use
continued
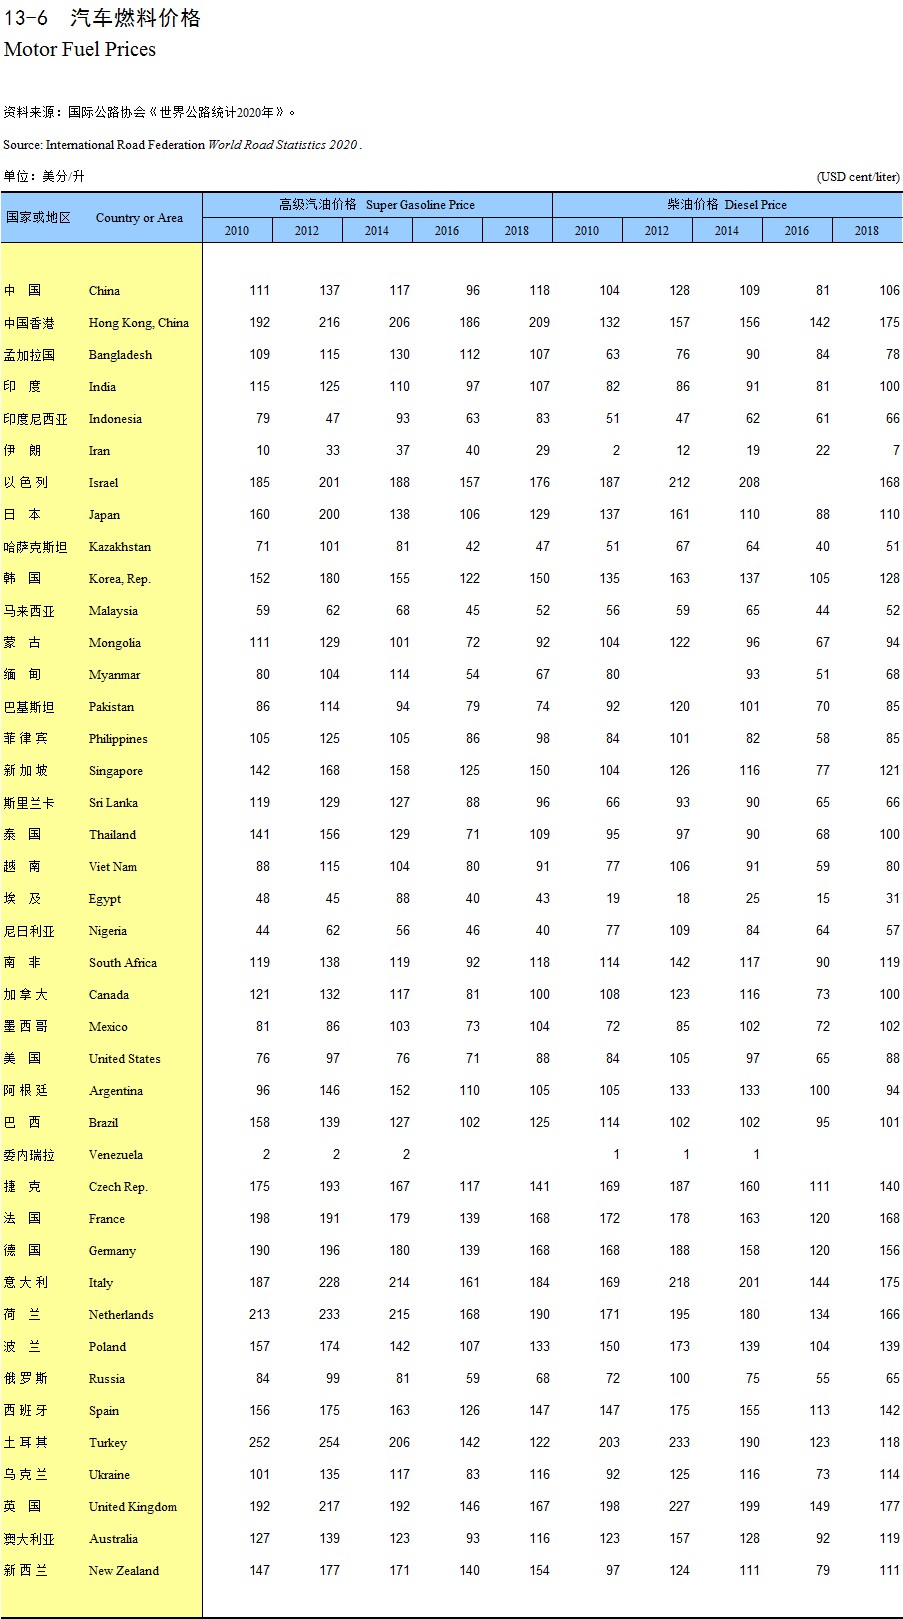
Motor Fuel Prices
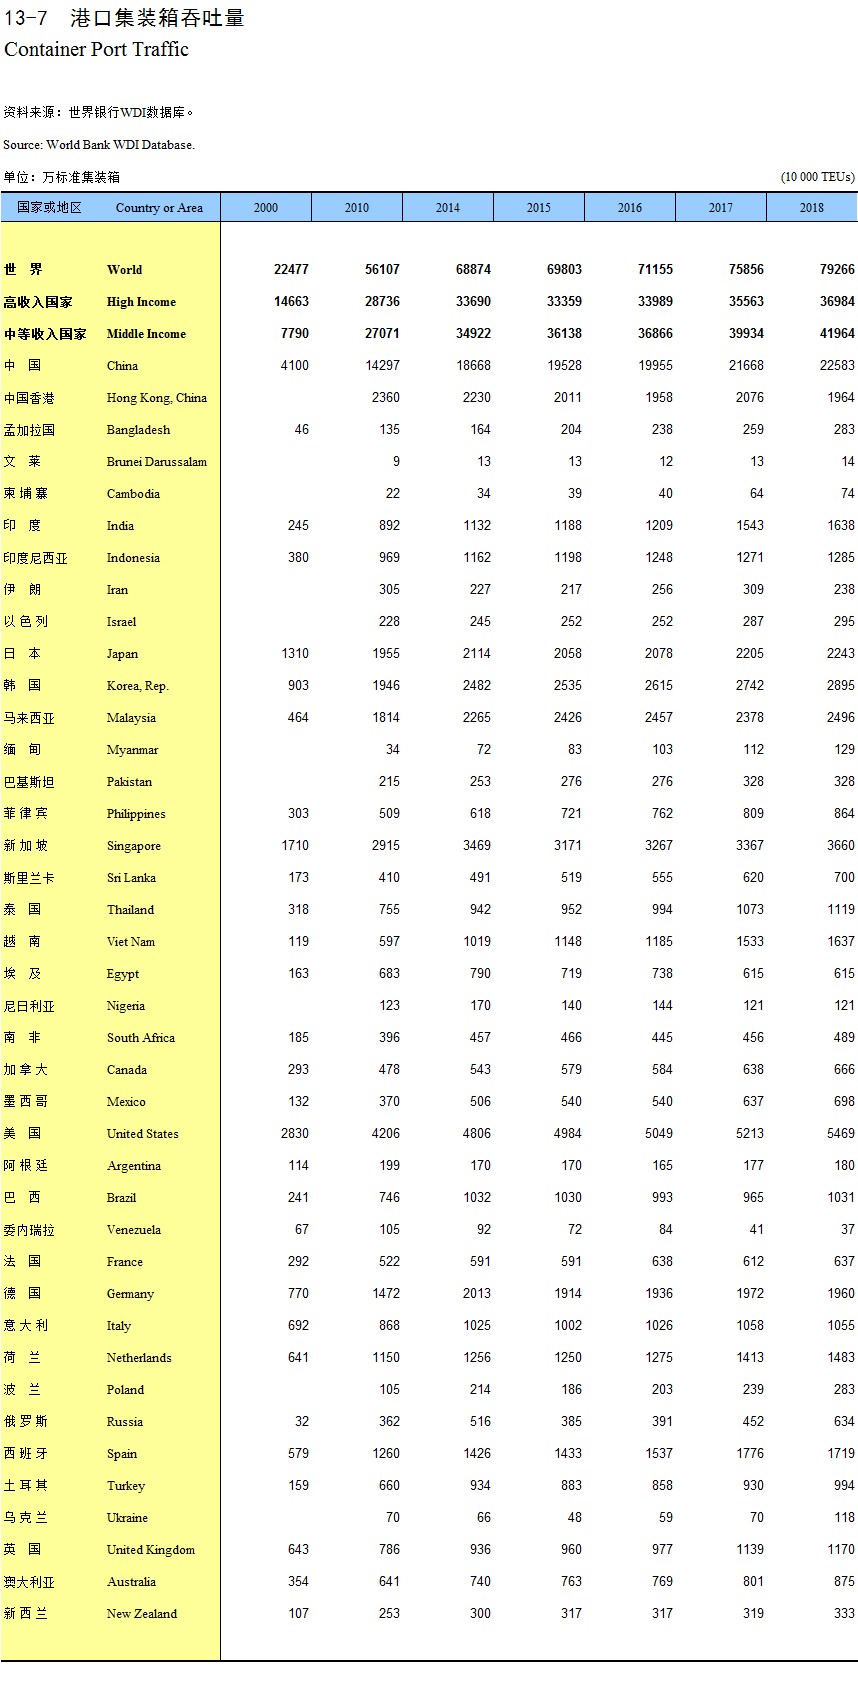
Container Port Traffic
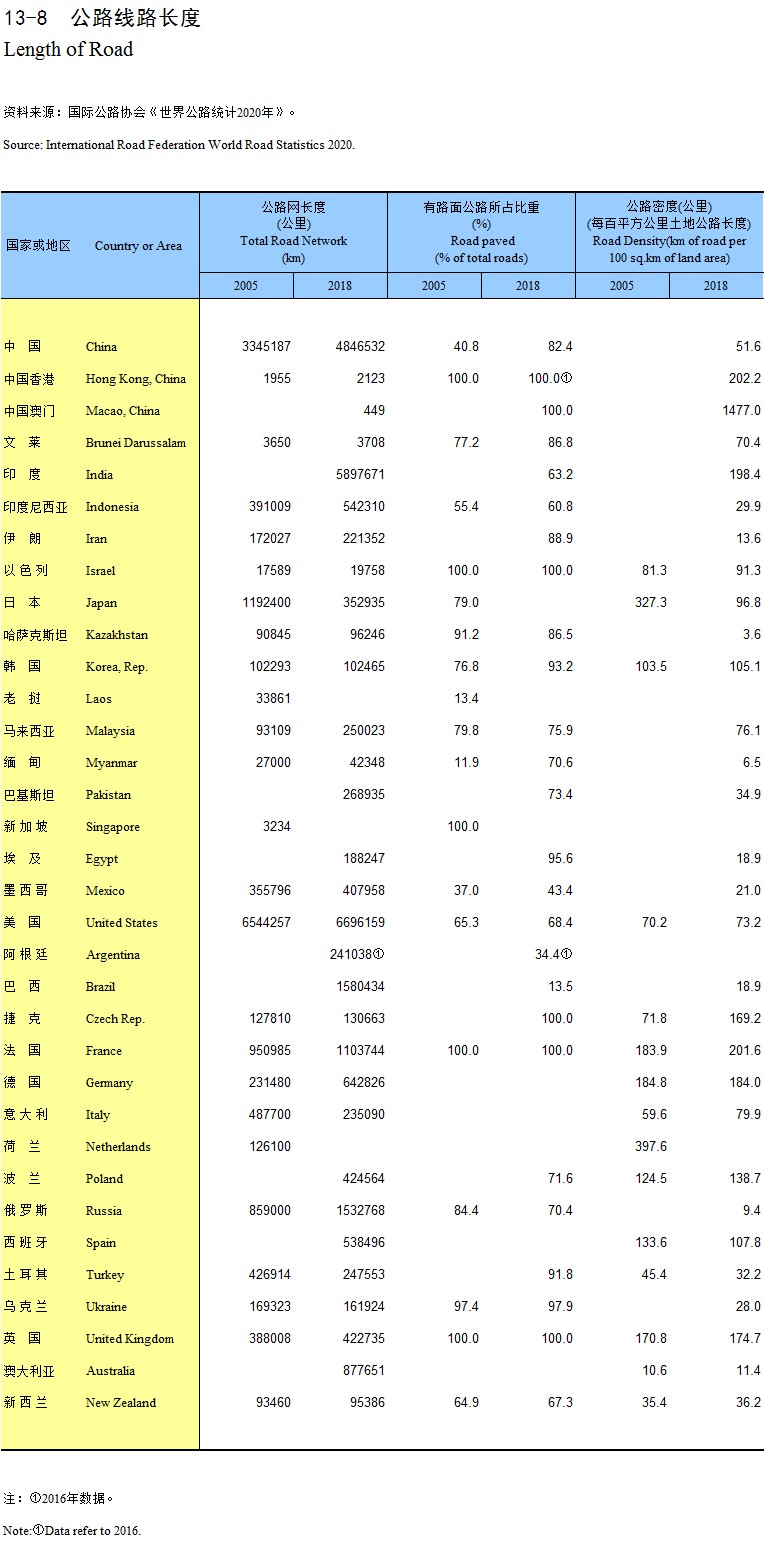
Length of Road
Road Accidents
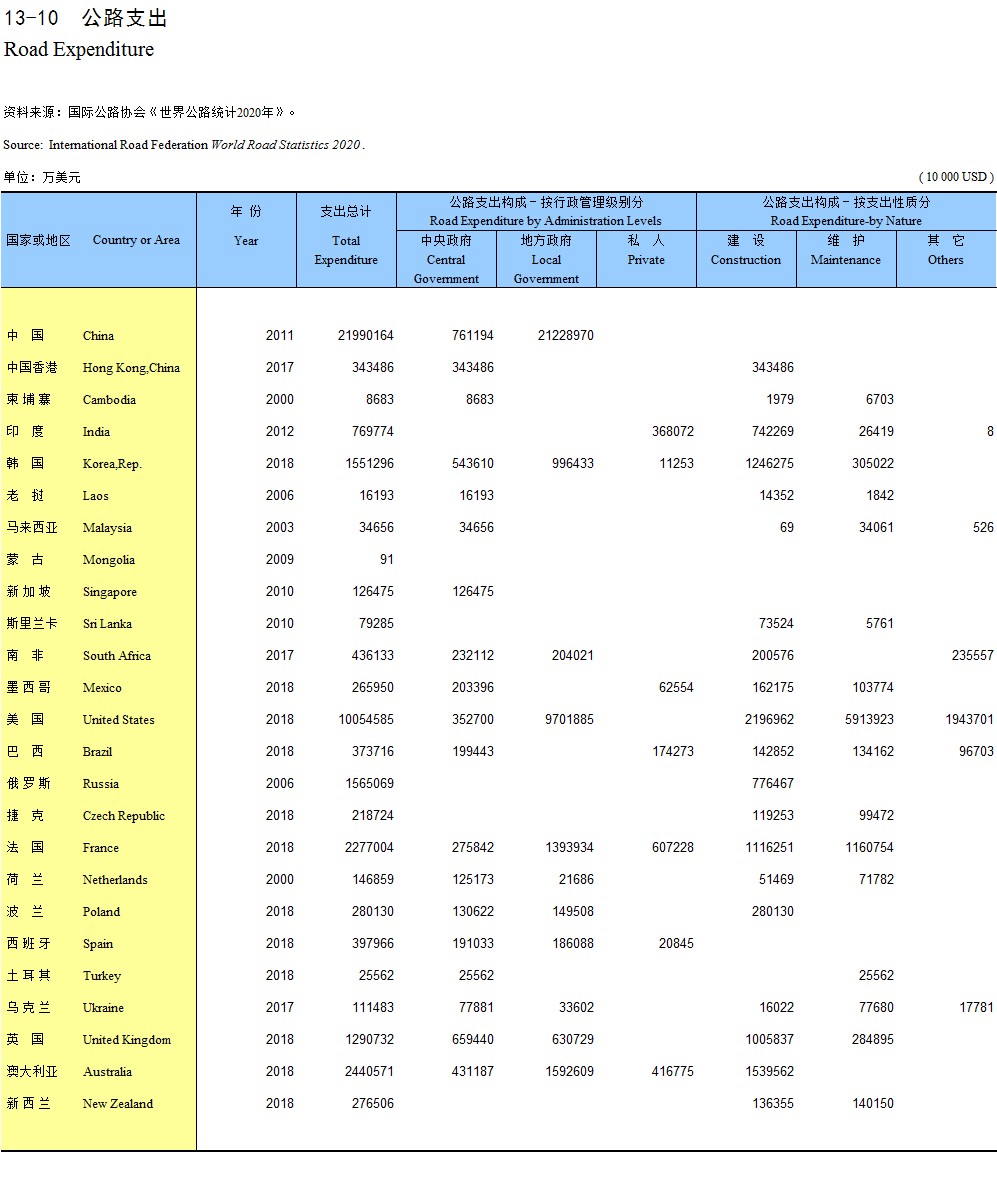
Road Expenditure
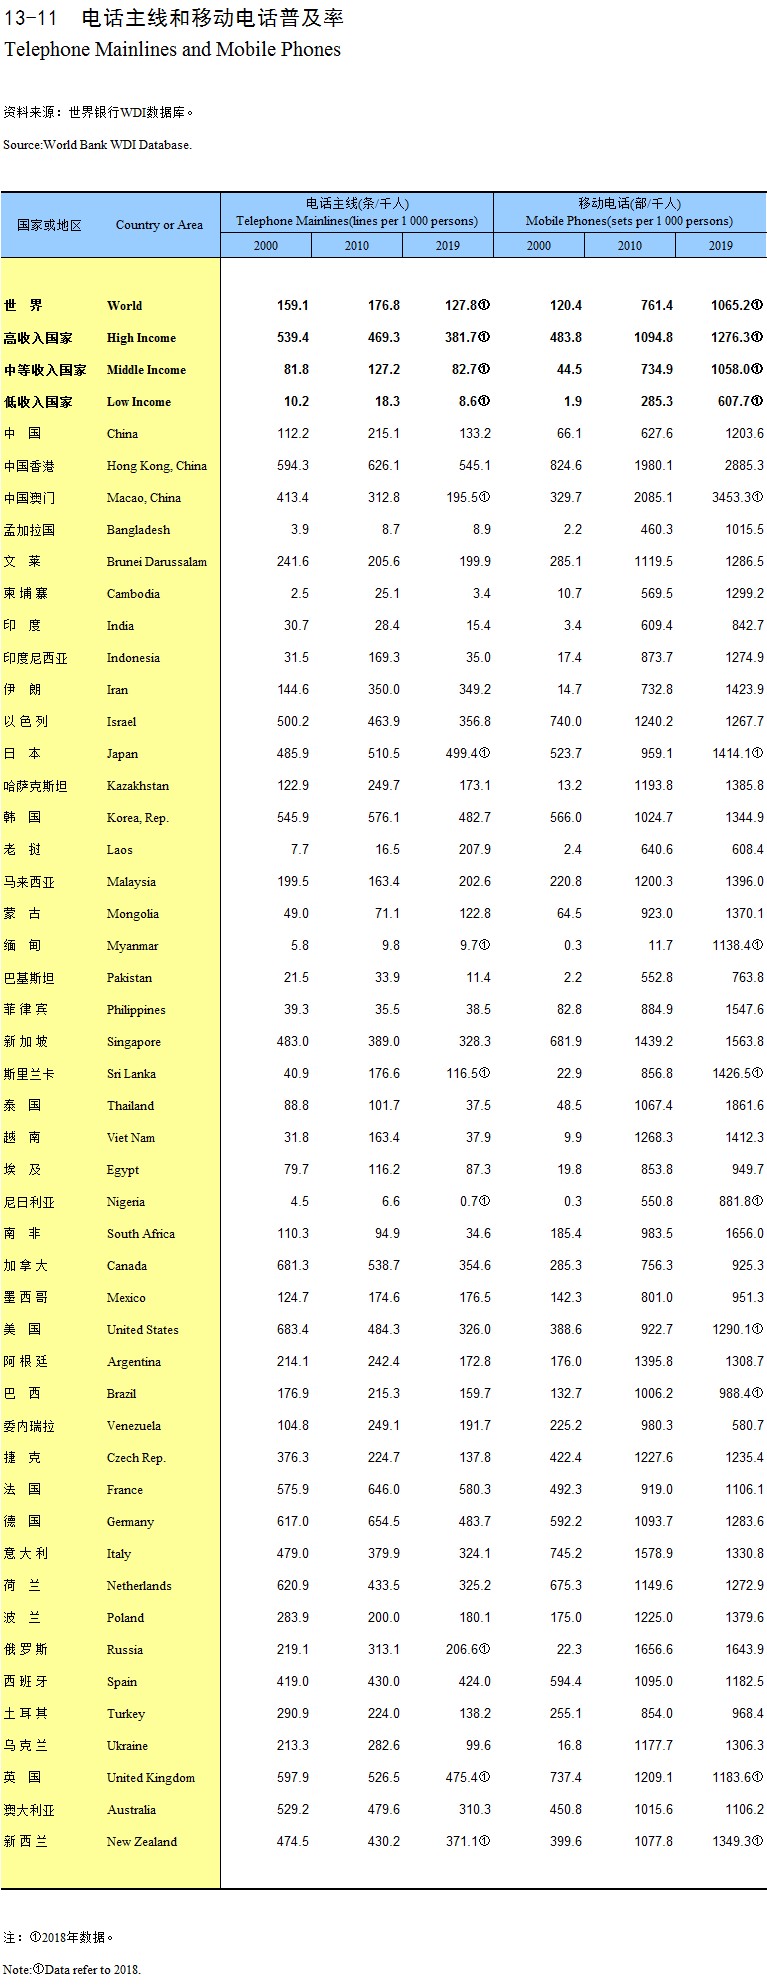
Telephone Mainlines and Mobile Phones
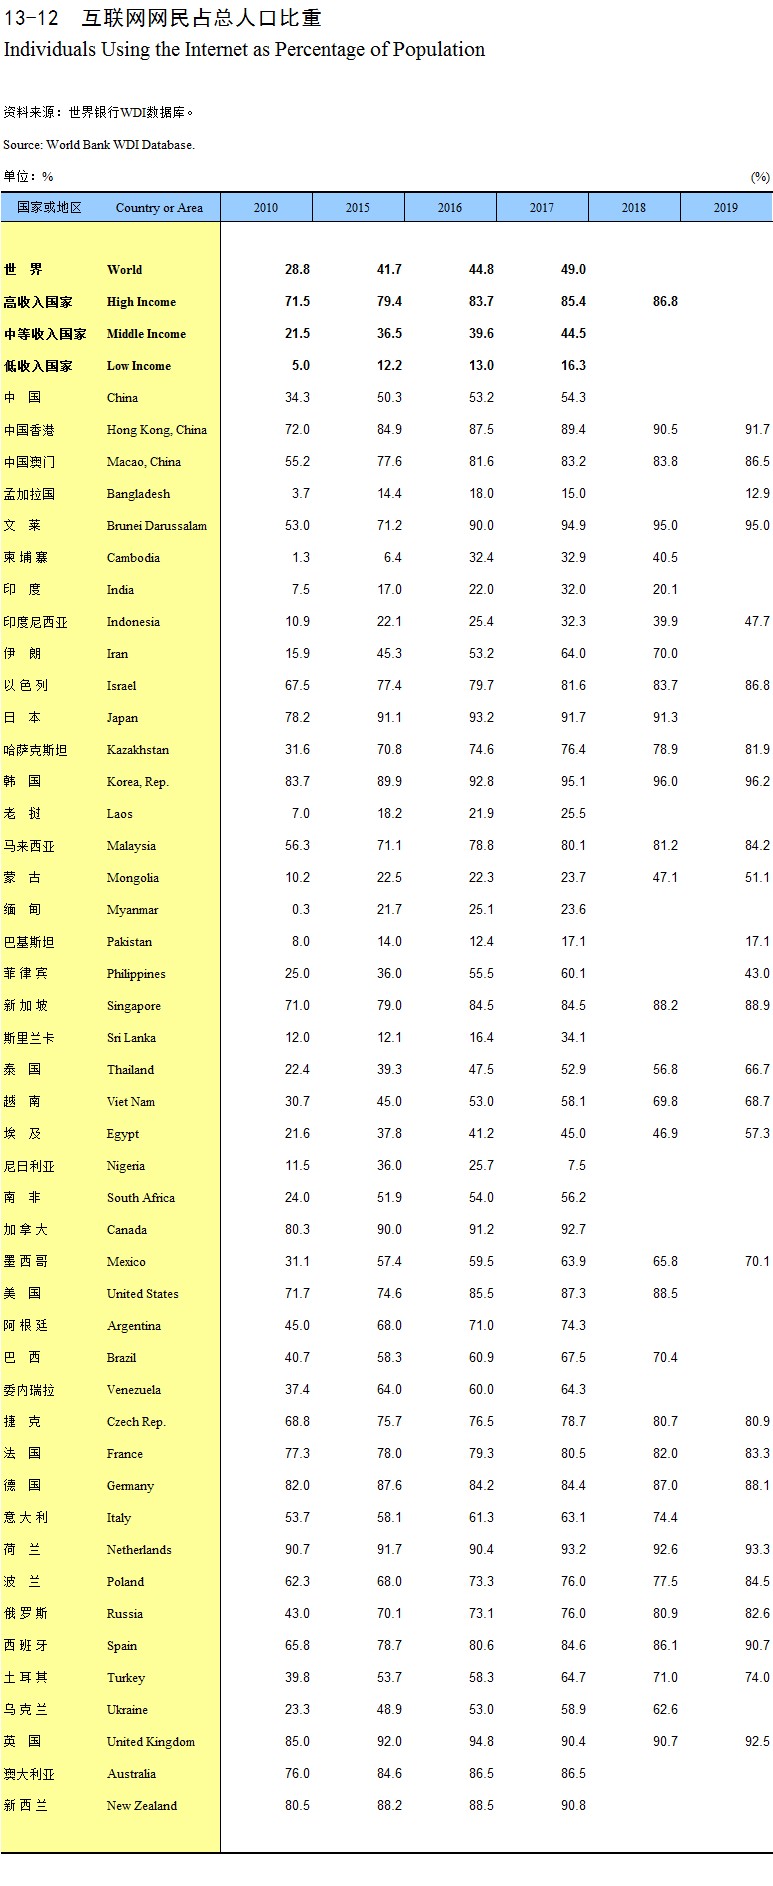
Individuals Using the Internet as Percentage of Population
Internet Servers
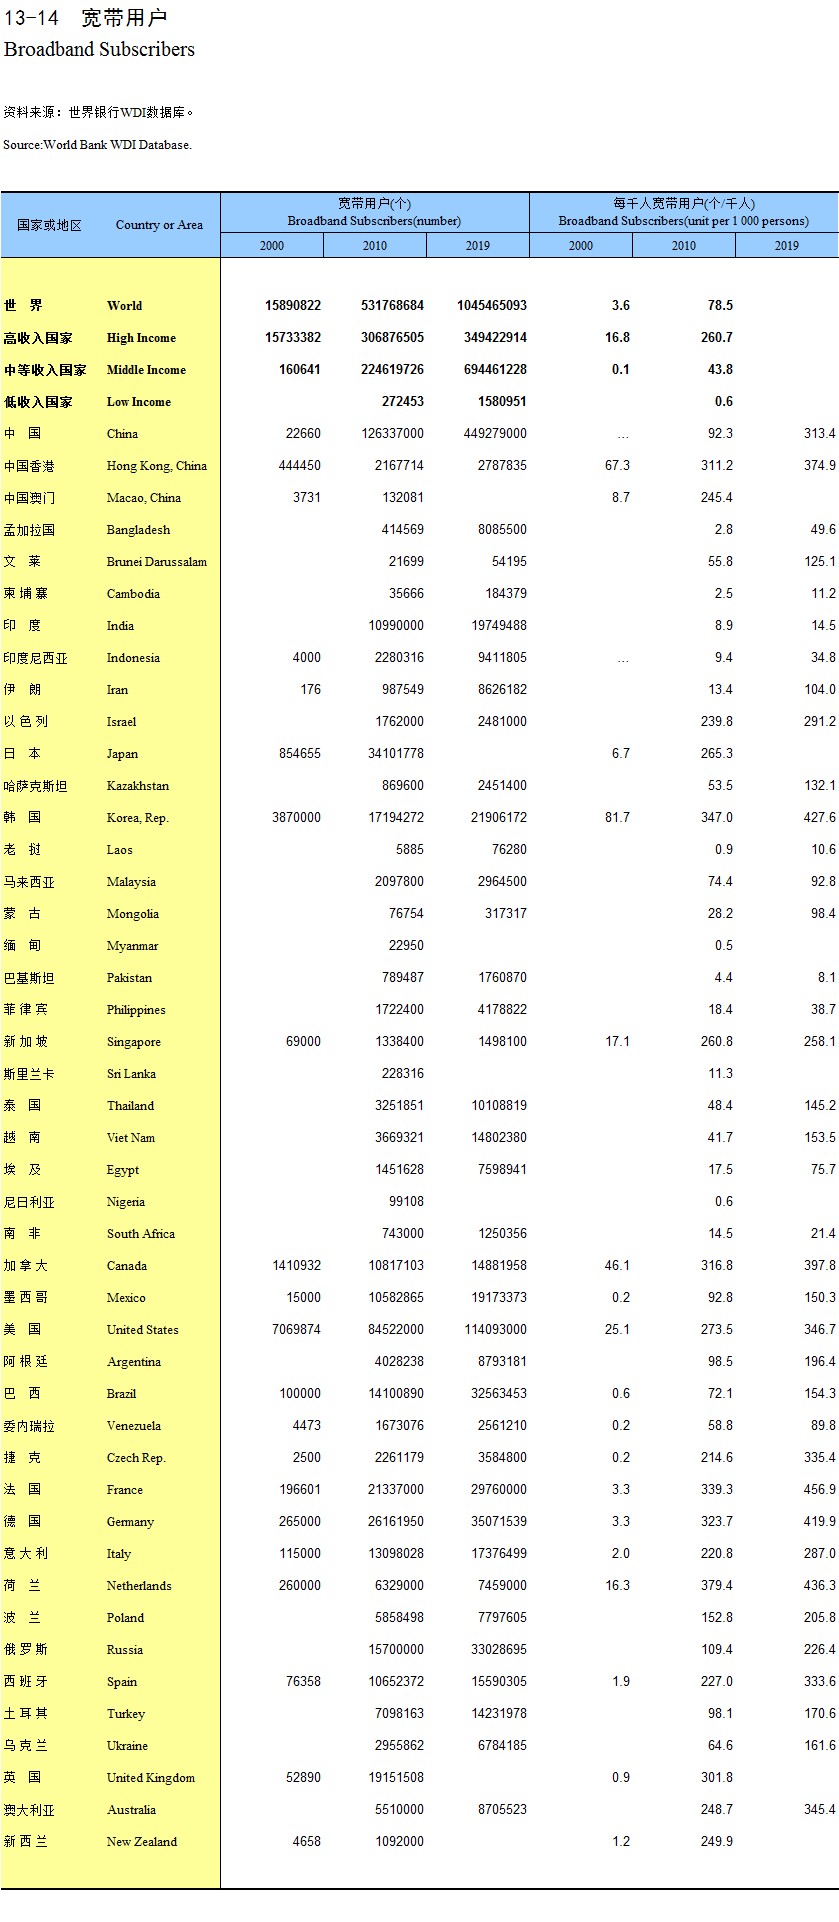
Broadband Subscribers
Explanatory Notes on Main Statistical Indicators
External Trade and Tourism
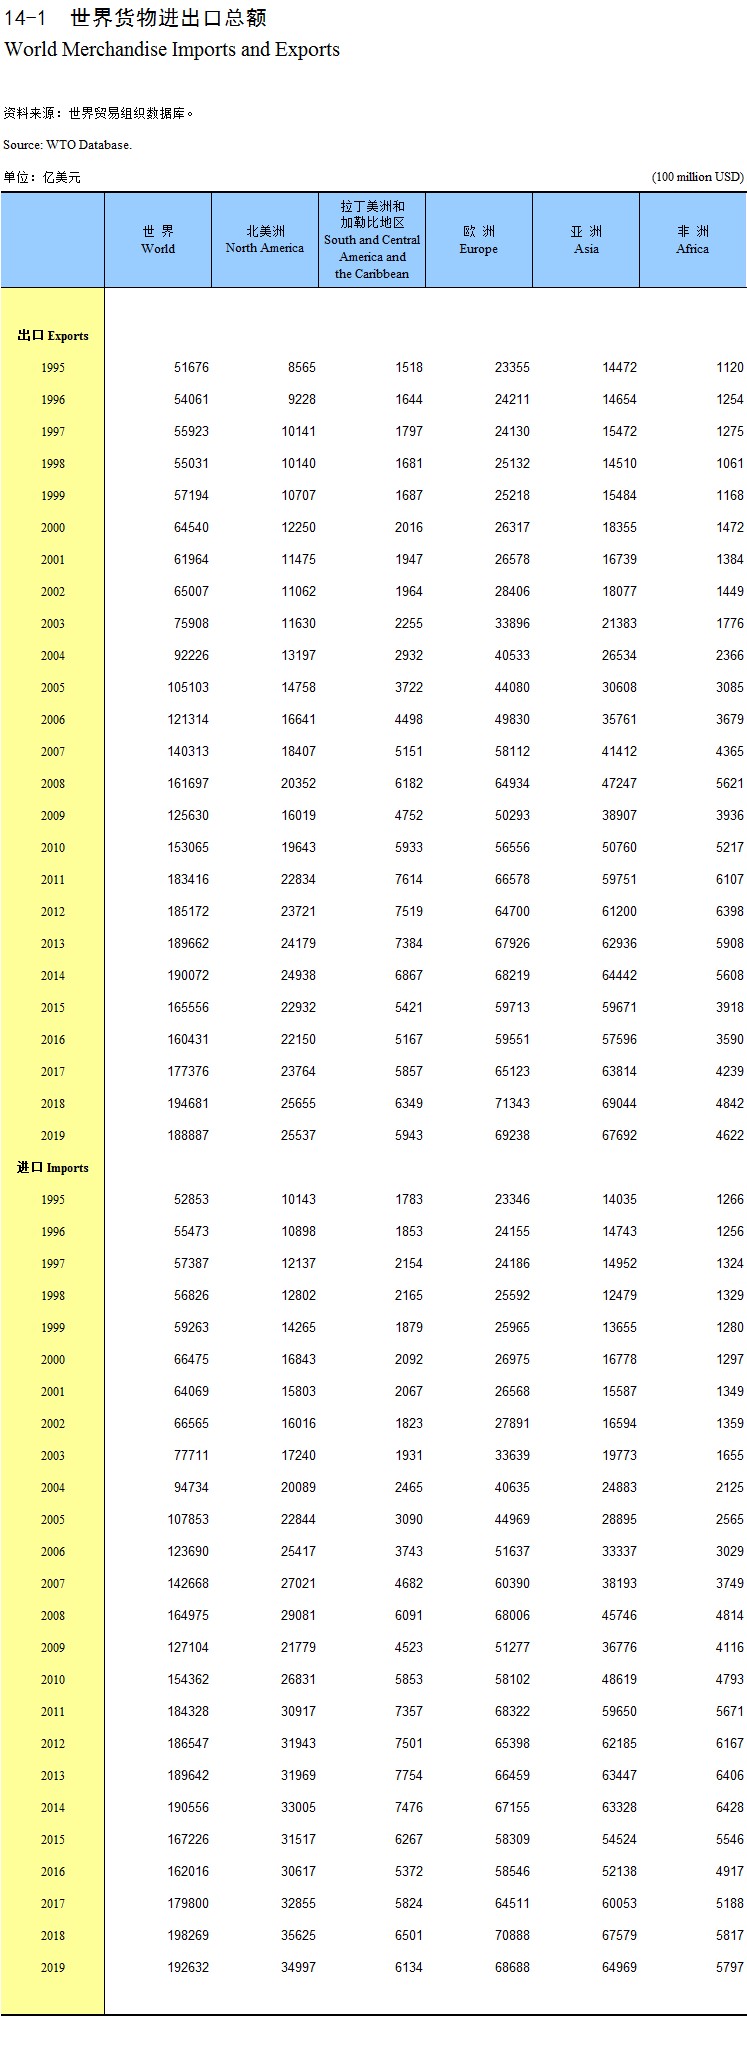
World Merchandise Imports and Exports
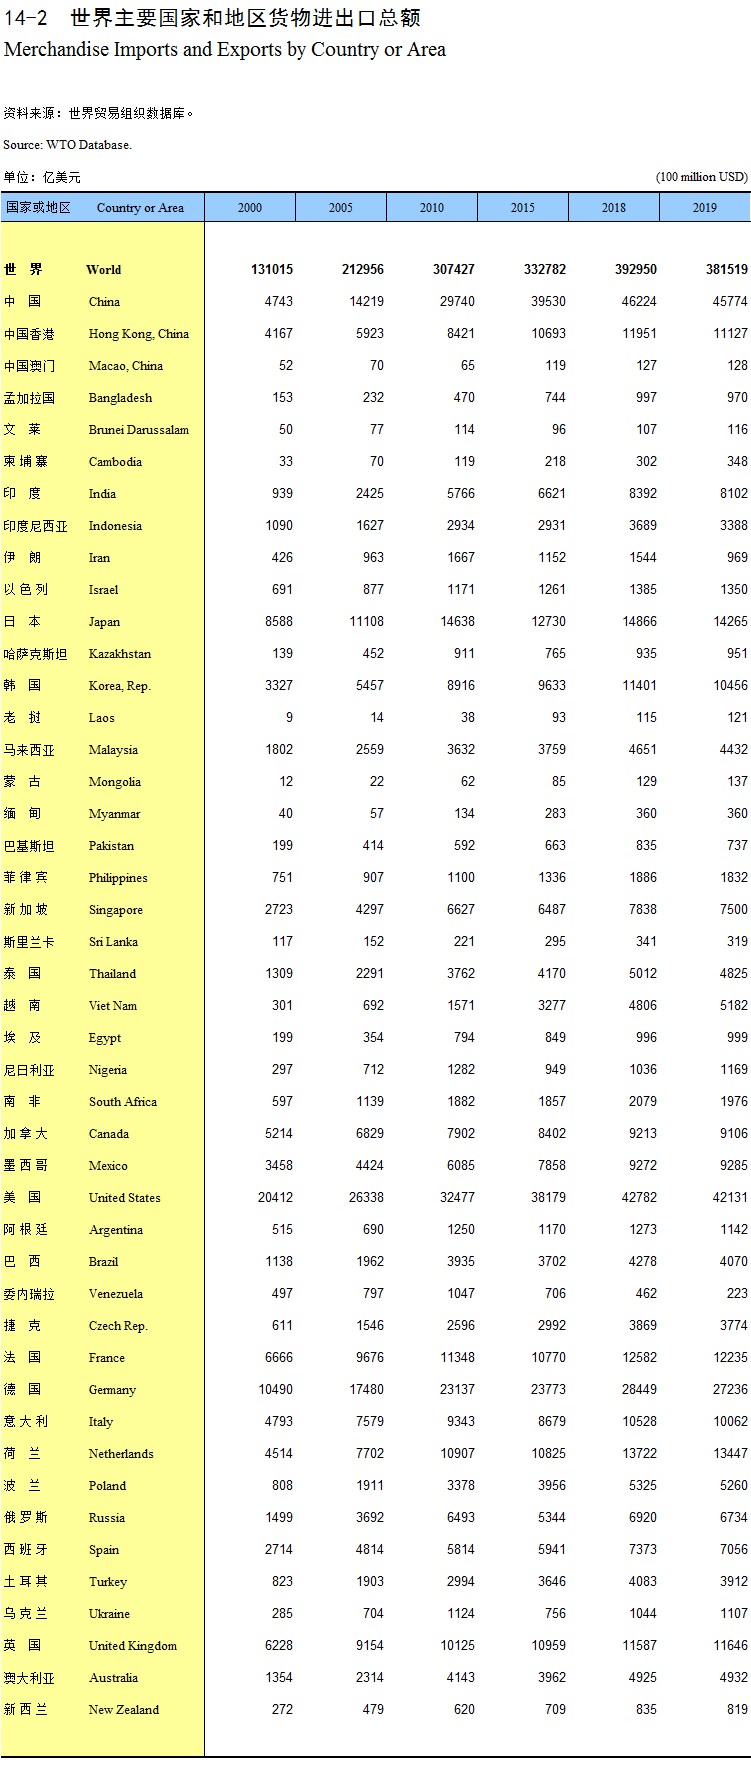
Merchandise Imports and Exports by Country or Area
Merchandise Exports
Merchandise Imports
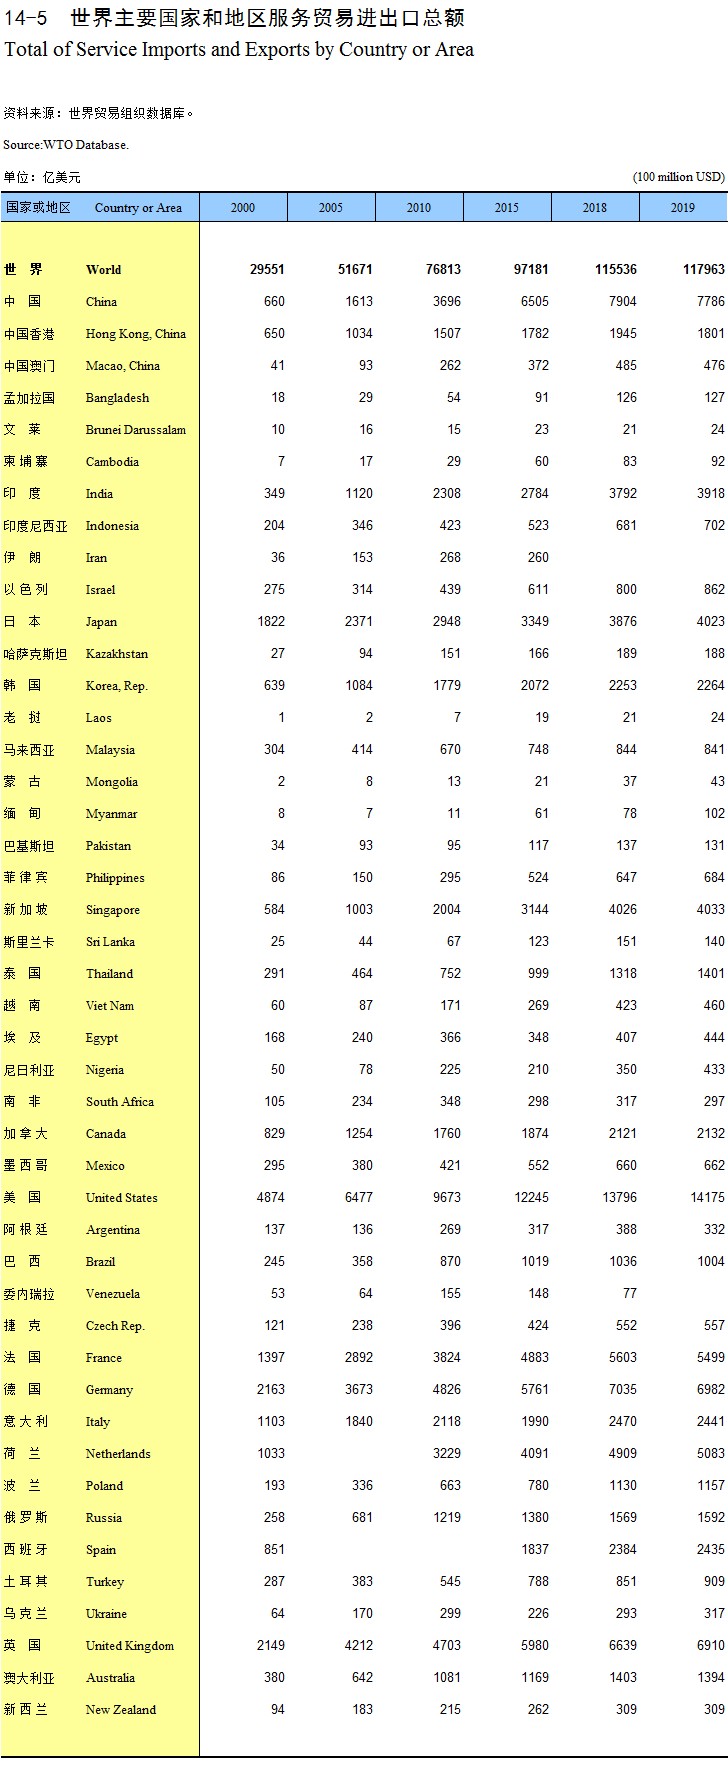
Total of Service Imports and Exports by Country or Area
Commercial Service Exports
Commercial Service Imports
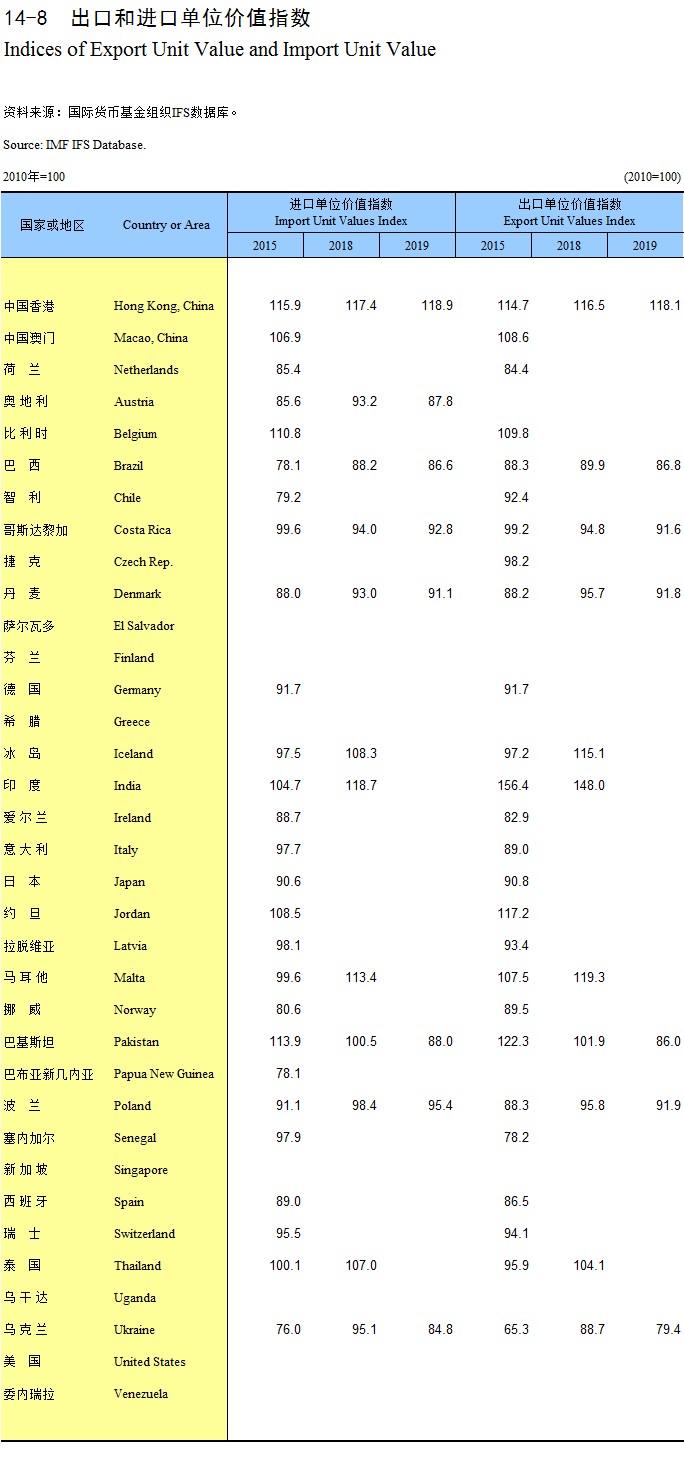
Indices of Export Unit Value and Import Unit Value
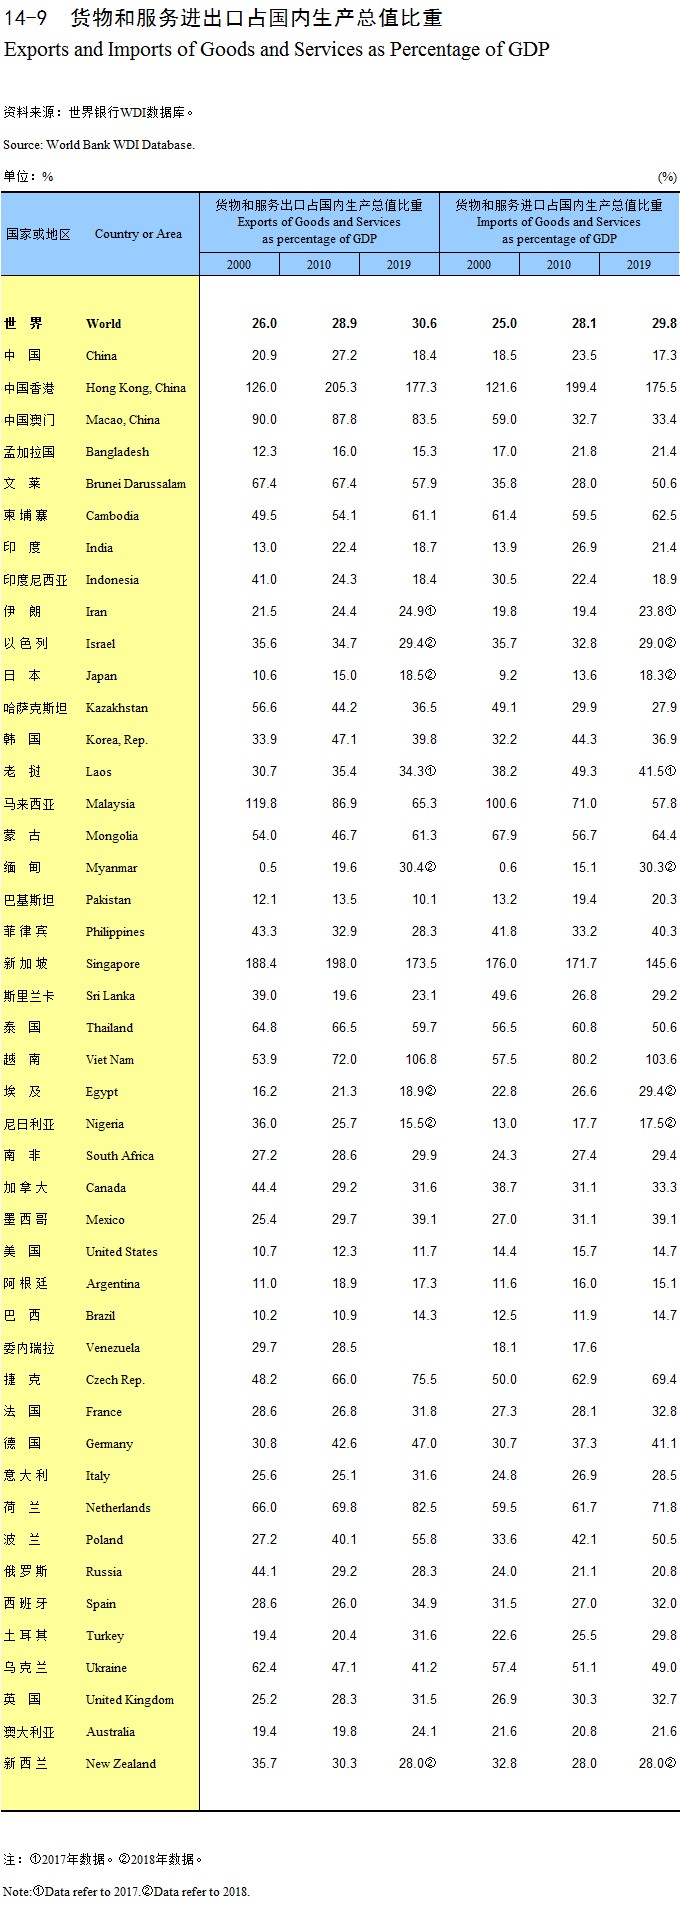
Exports and Imports of Goods and Services as Percentage of GDP
Exports by Commodity Groups (2019)
Imports by Commodity Groups (2019)
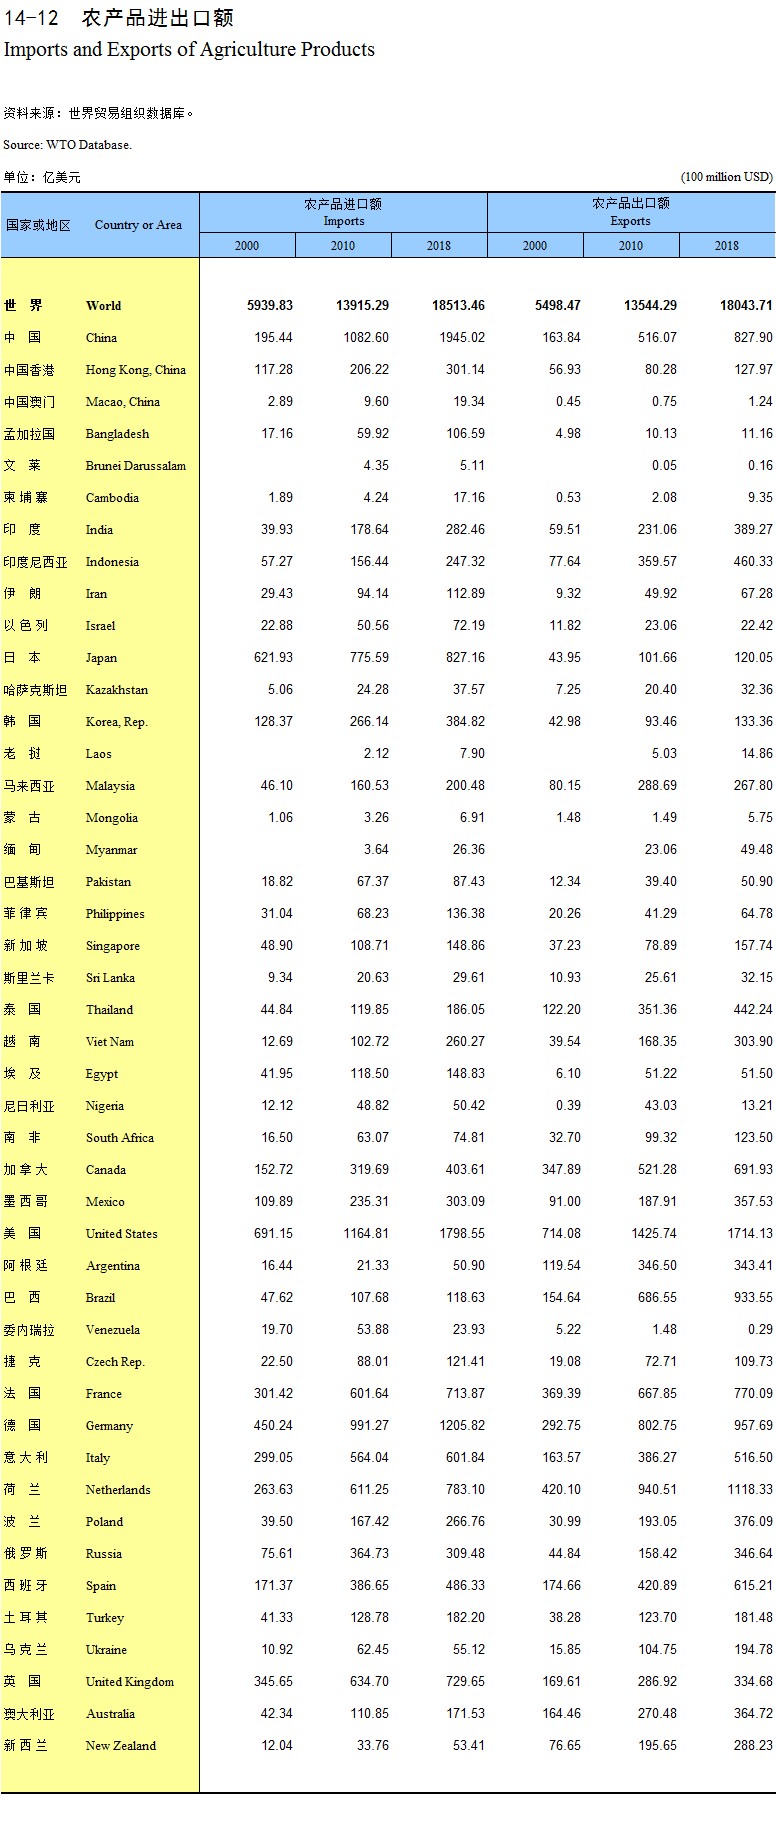
Imports and Exports of Agriculture Products
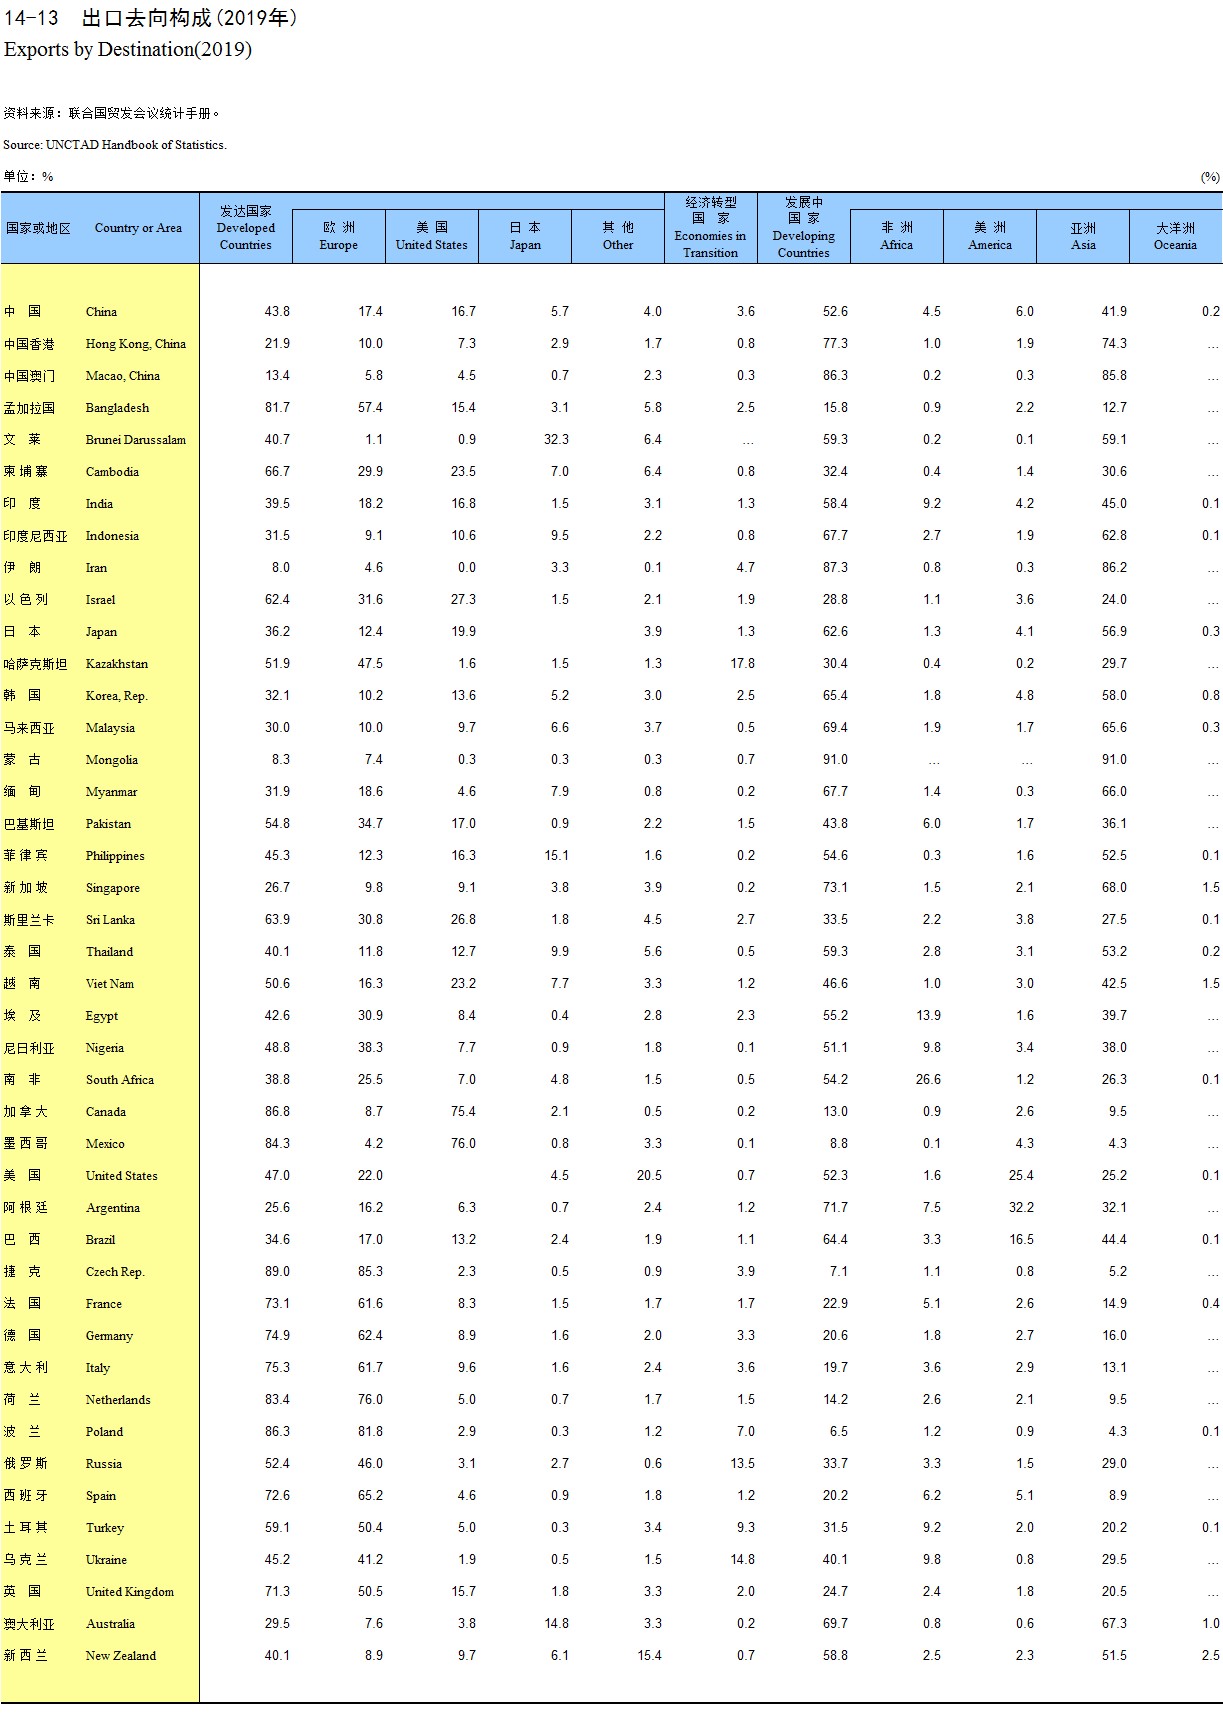
Exports by Destination (2019)
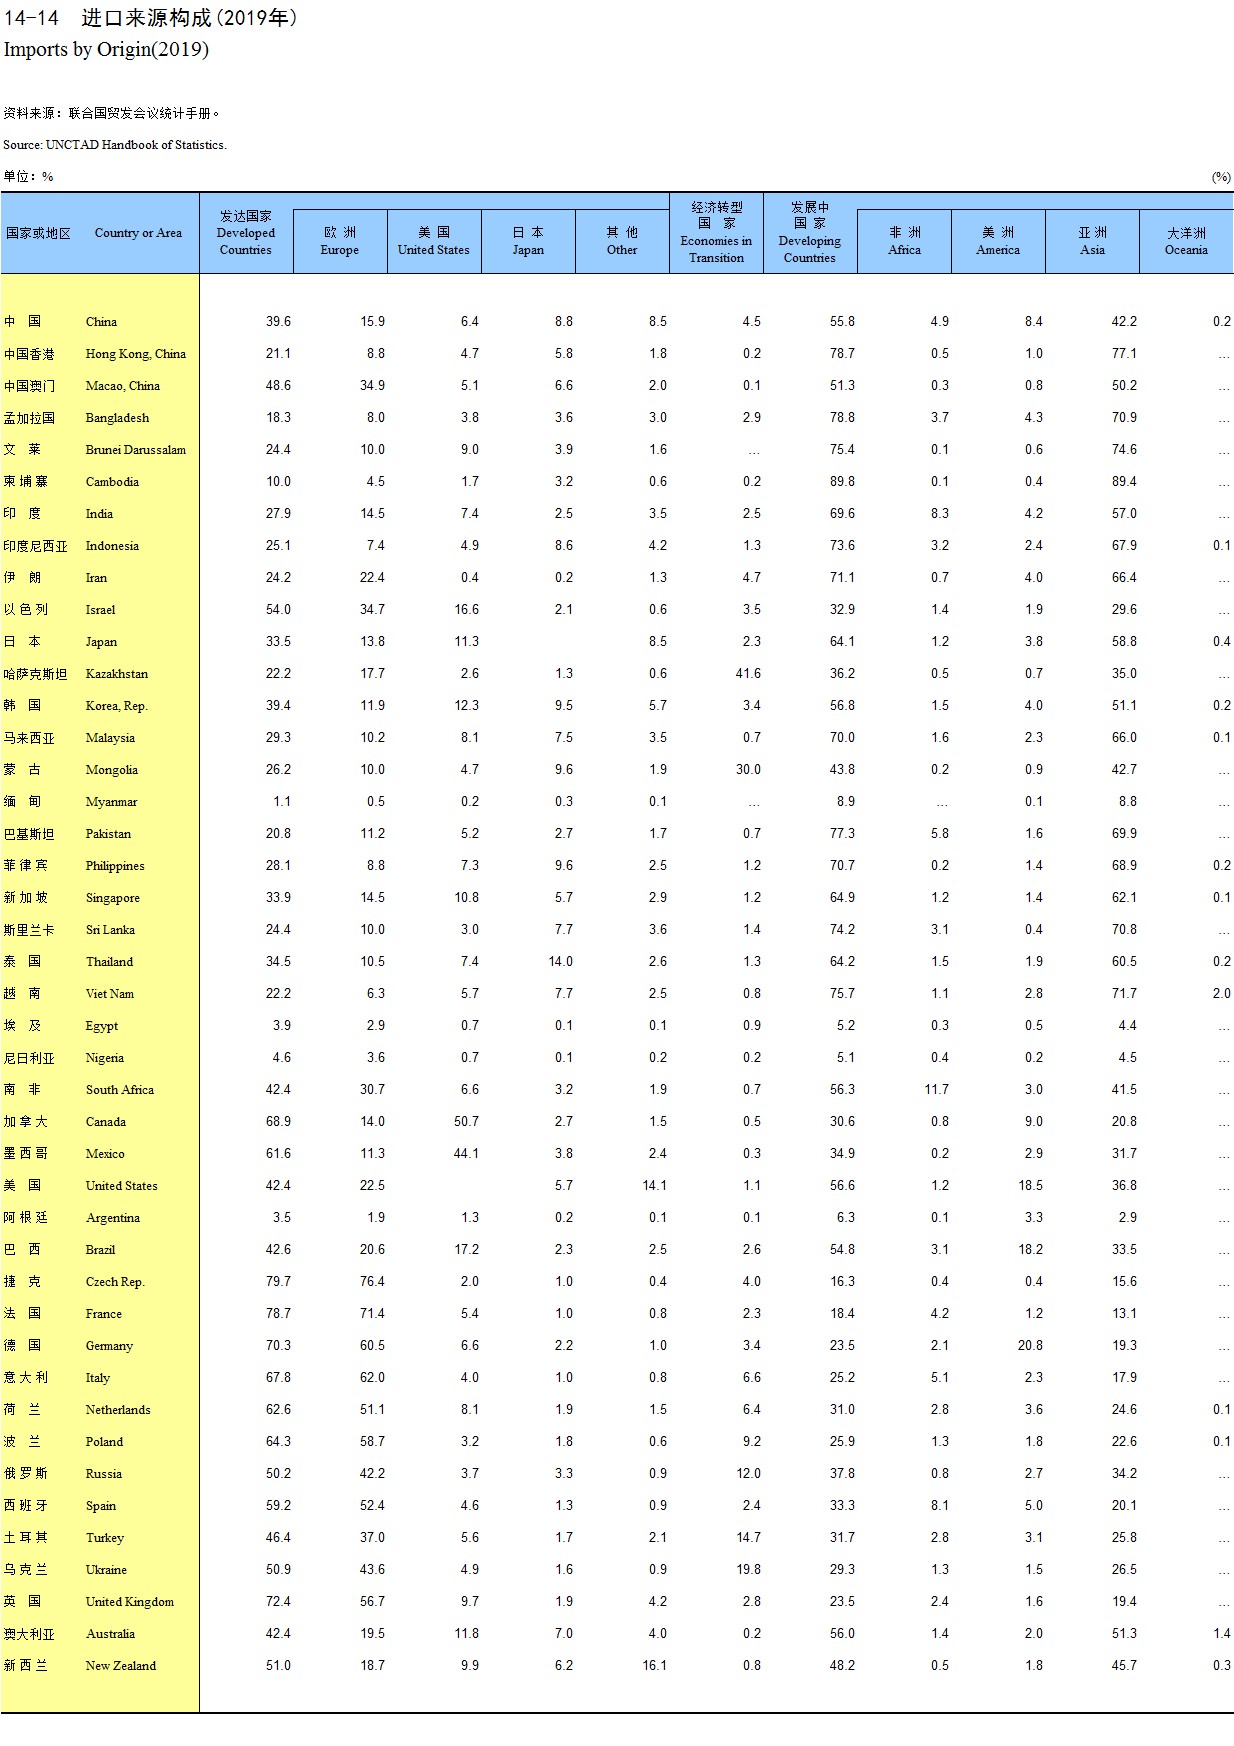
Imports by Origin (2019)
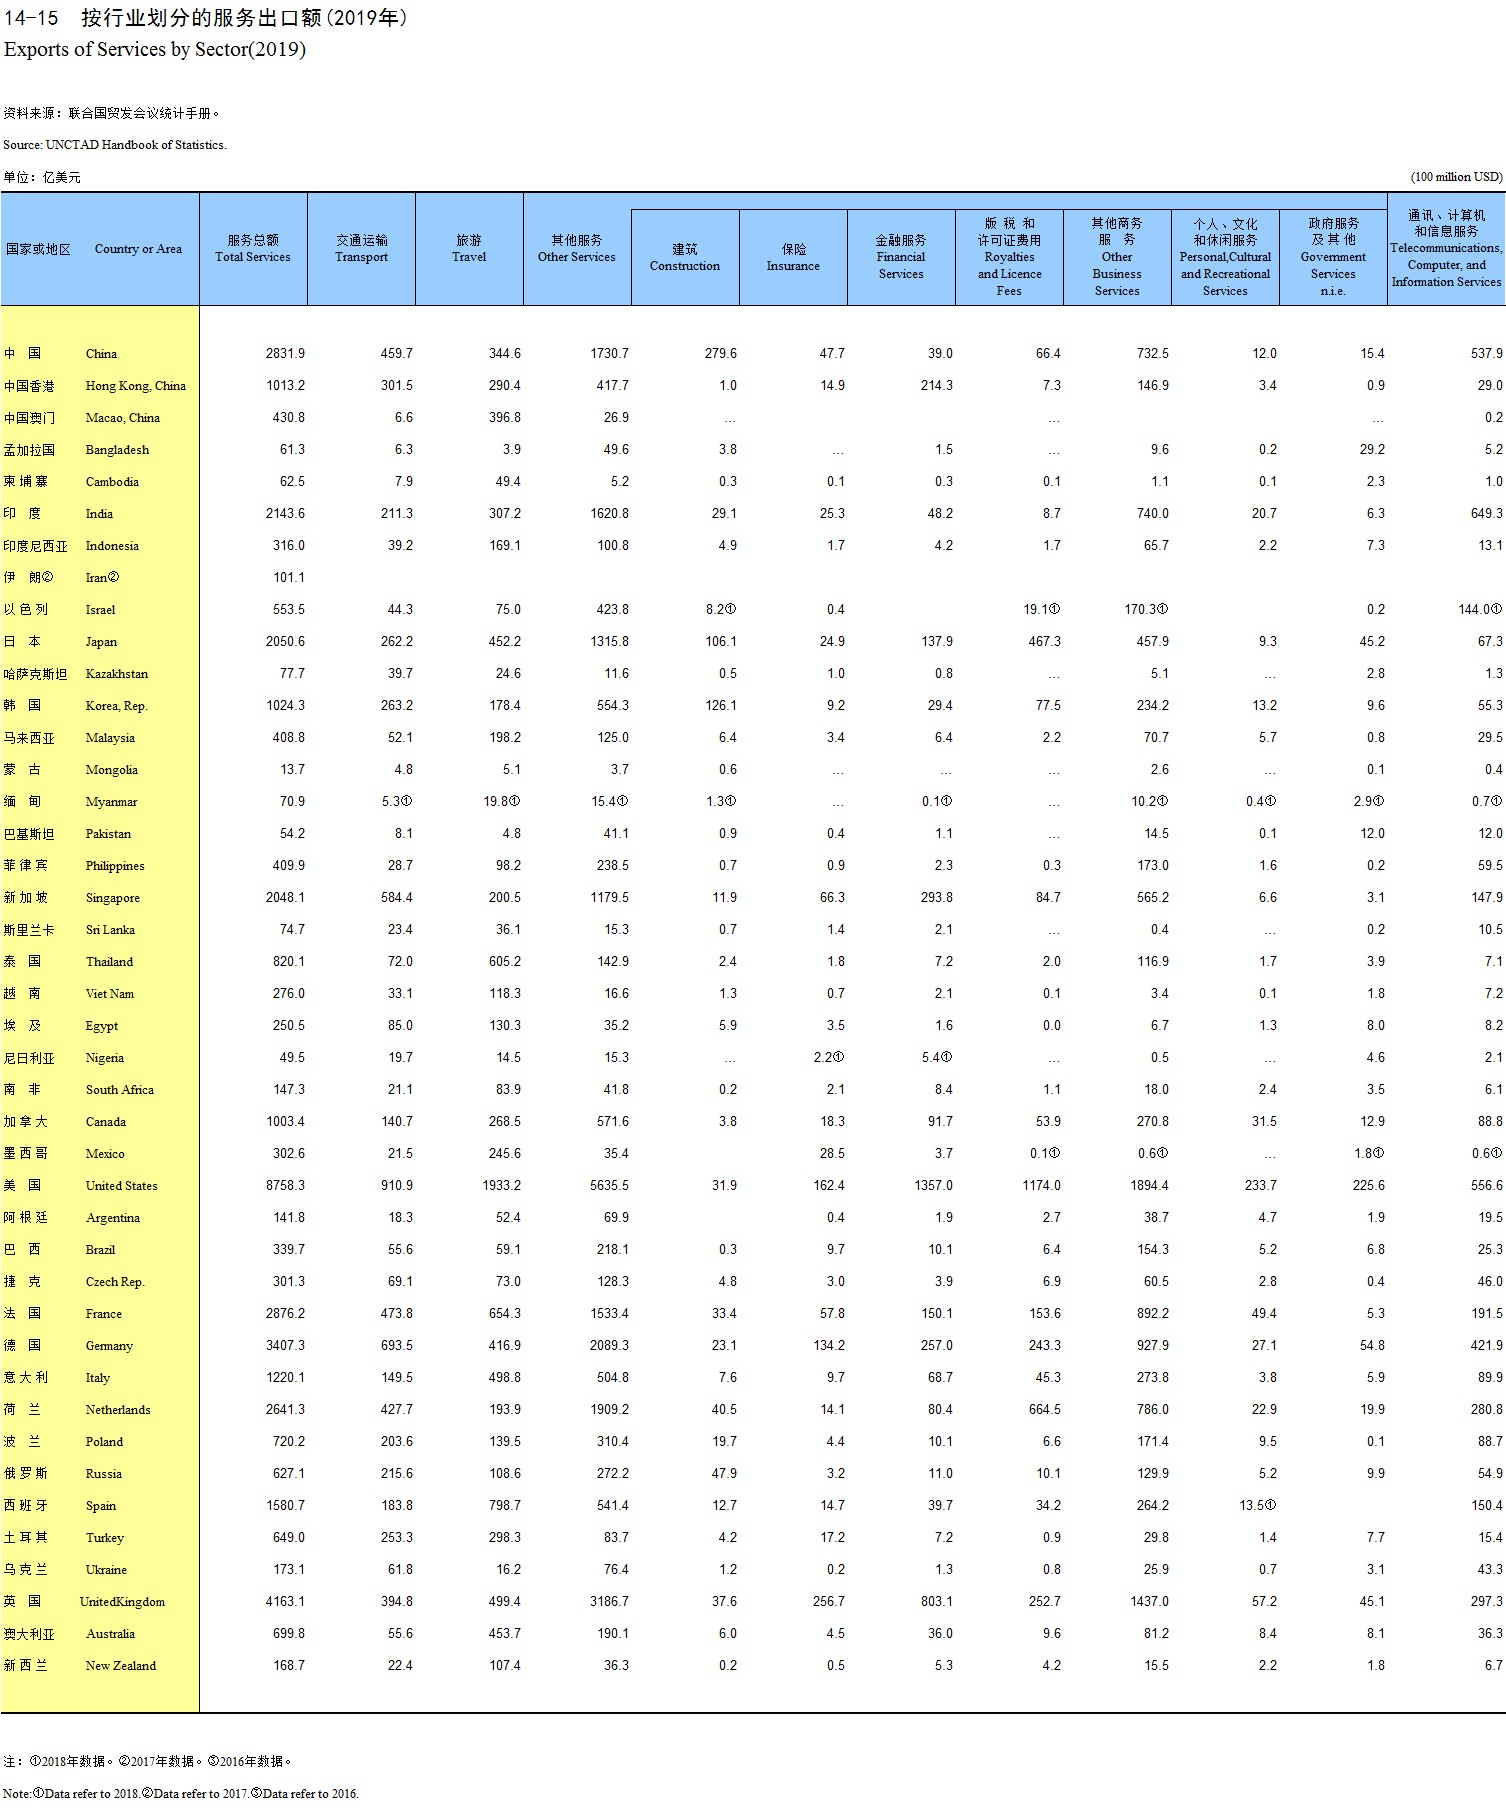
Exports of Services by Sector (2019)
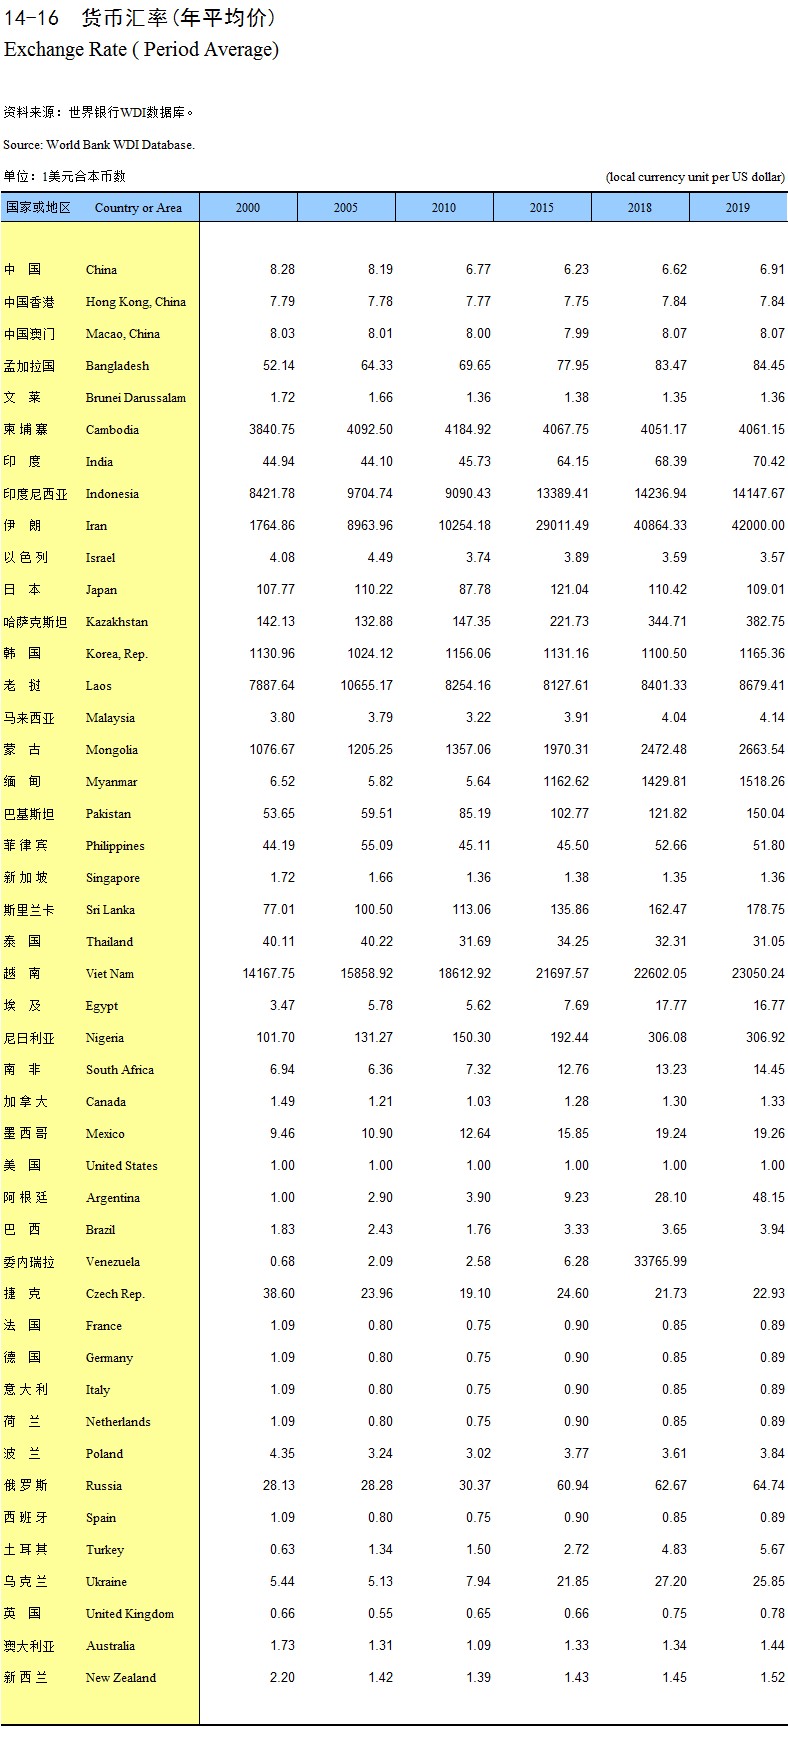
Exchange Rate (Period Average)
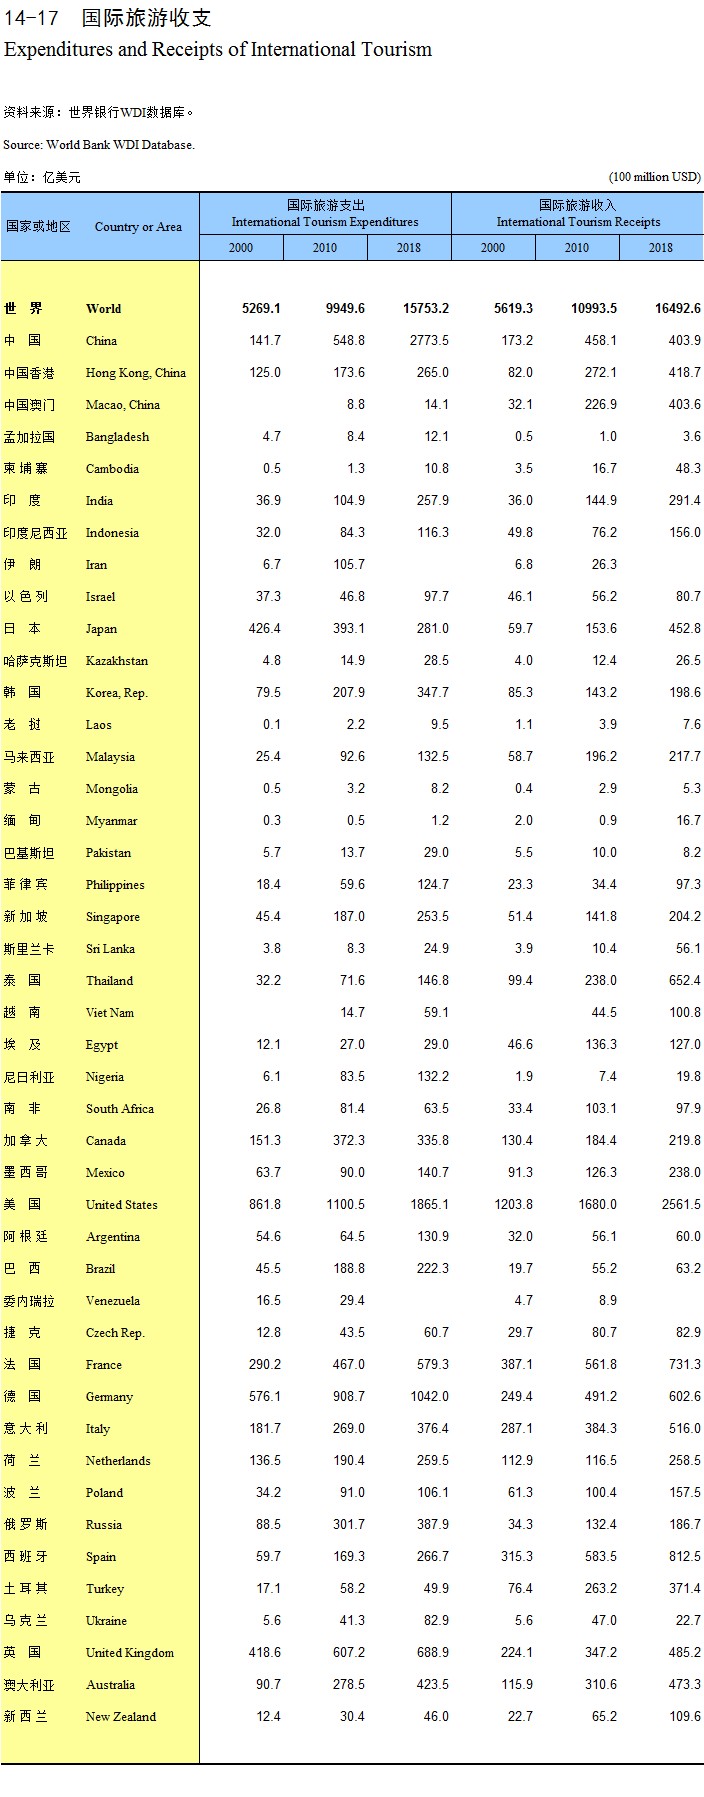
Expenditures and Receipts of International Tourism
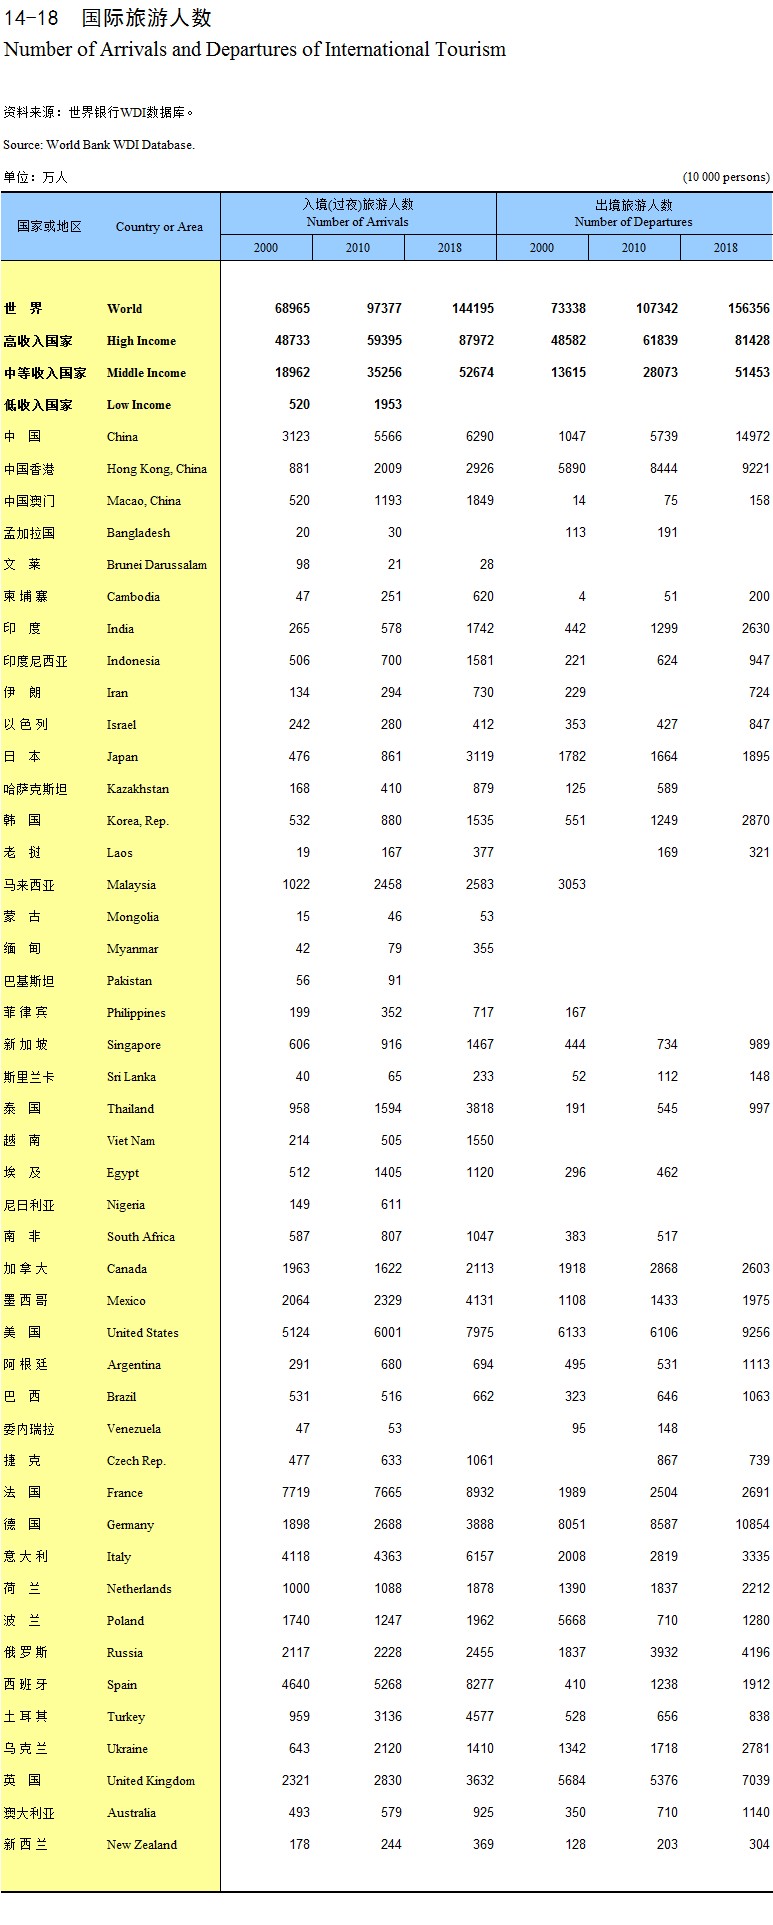
Number of Arrivals and Departures of International Tourism
Explanatory Notes on Main Statistical Indicators
Balance of Payments and External Debts
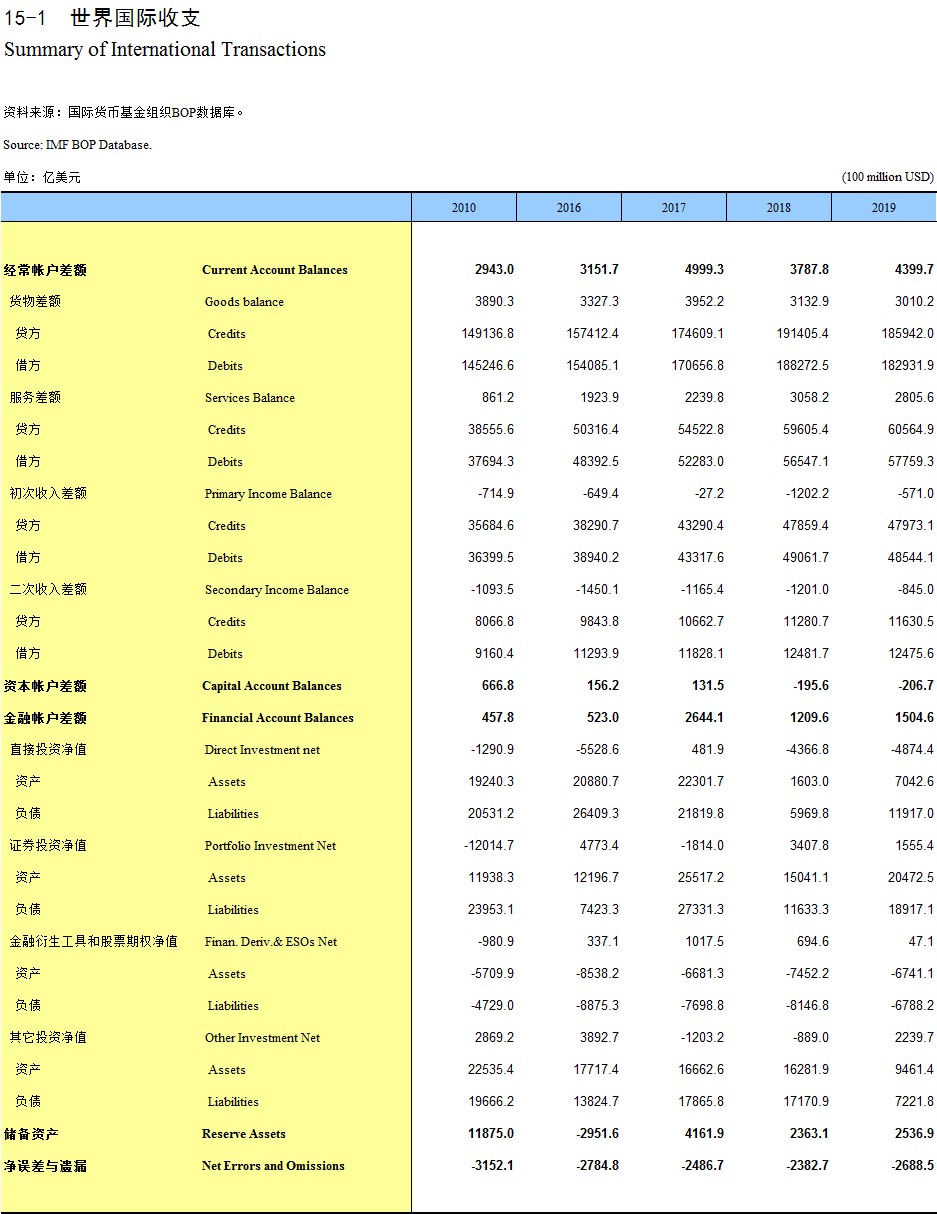
Summary of International Transactions
Balance of Payments by Country or Area (2018)
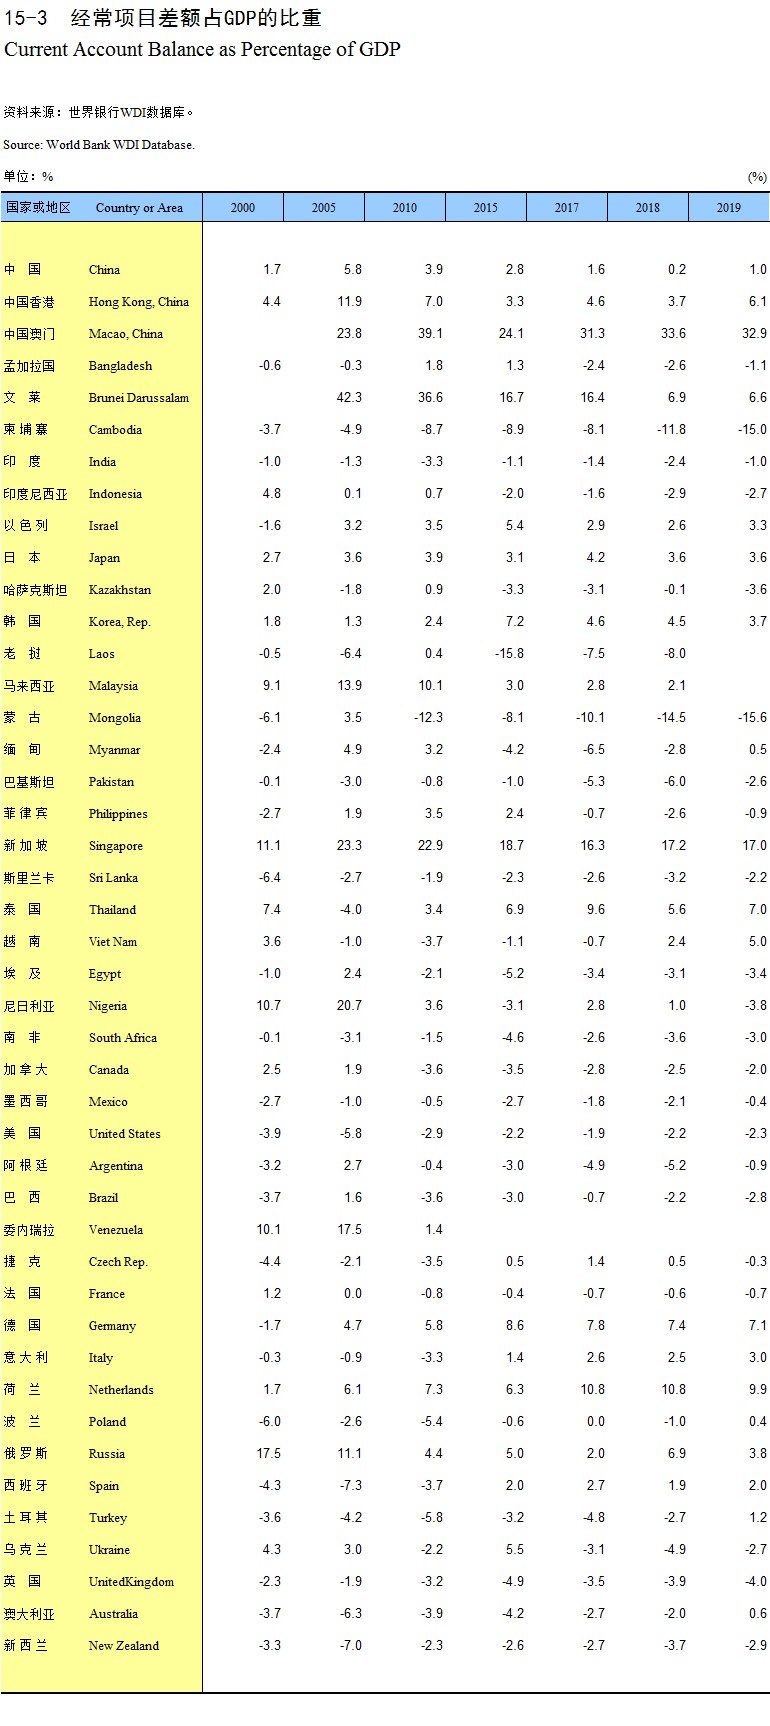
Current Account Balance as Percentage of GDP
Foreign Direct Investment
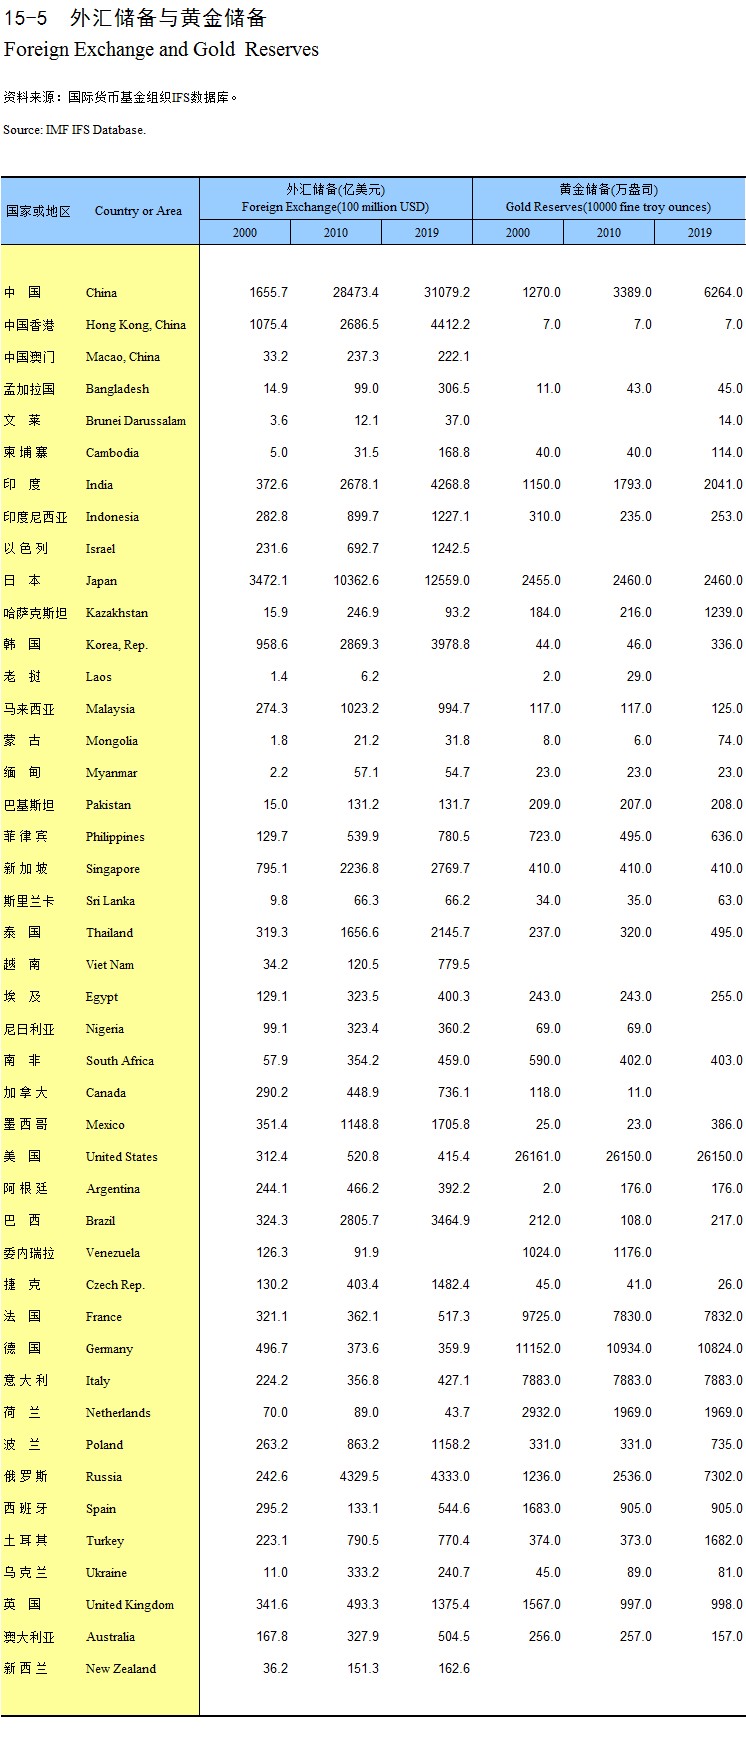
Foreign Exchange and Gold Reserves
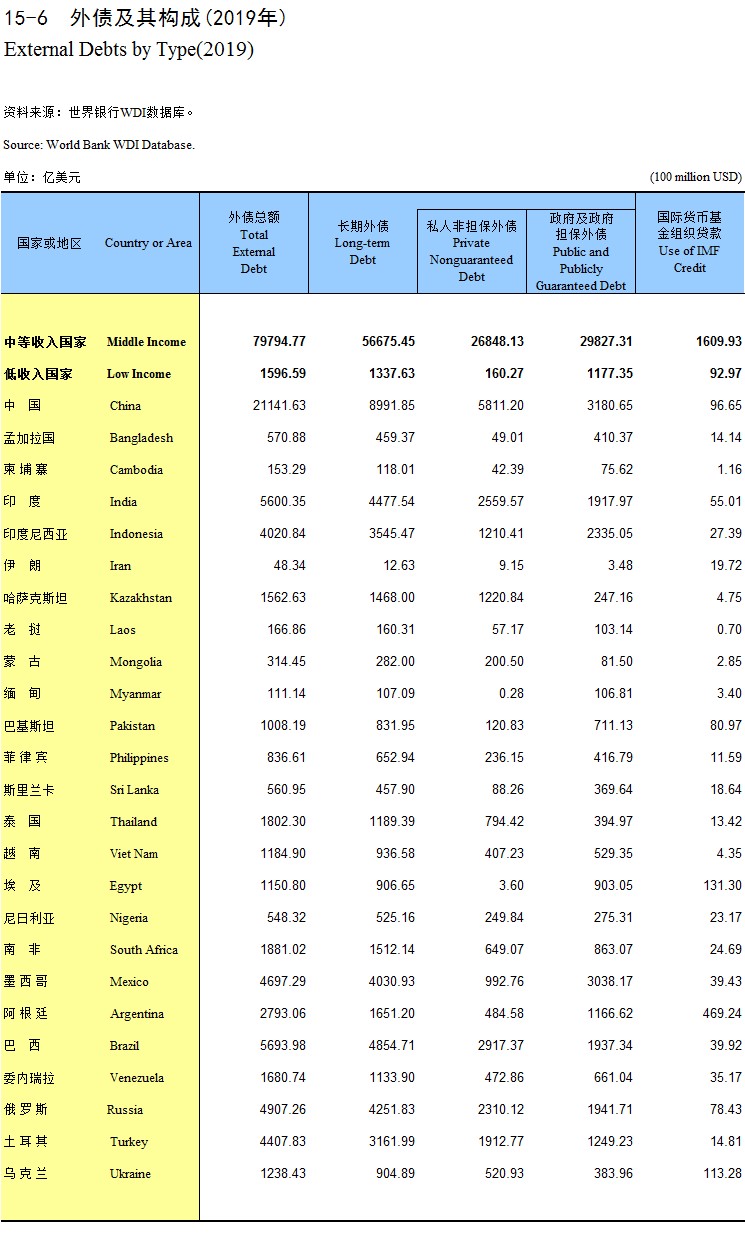
External Debts by Type (2019)
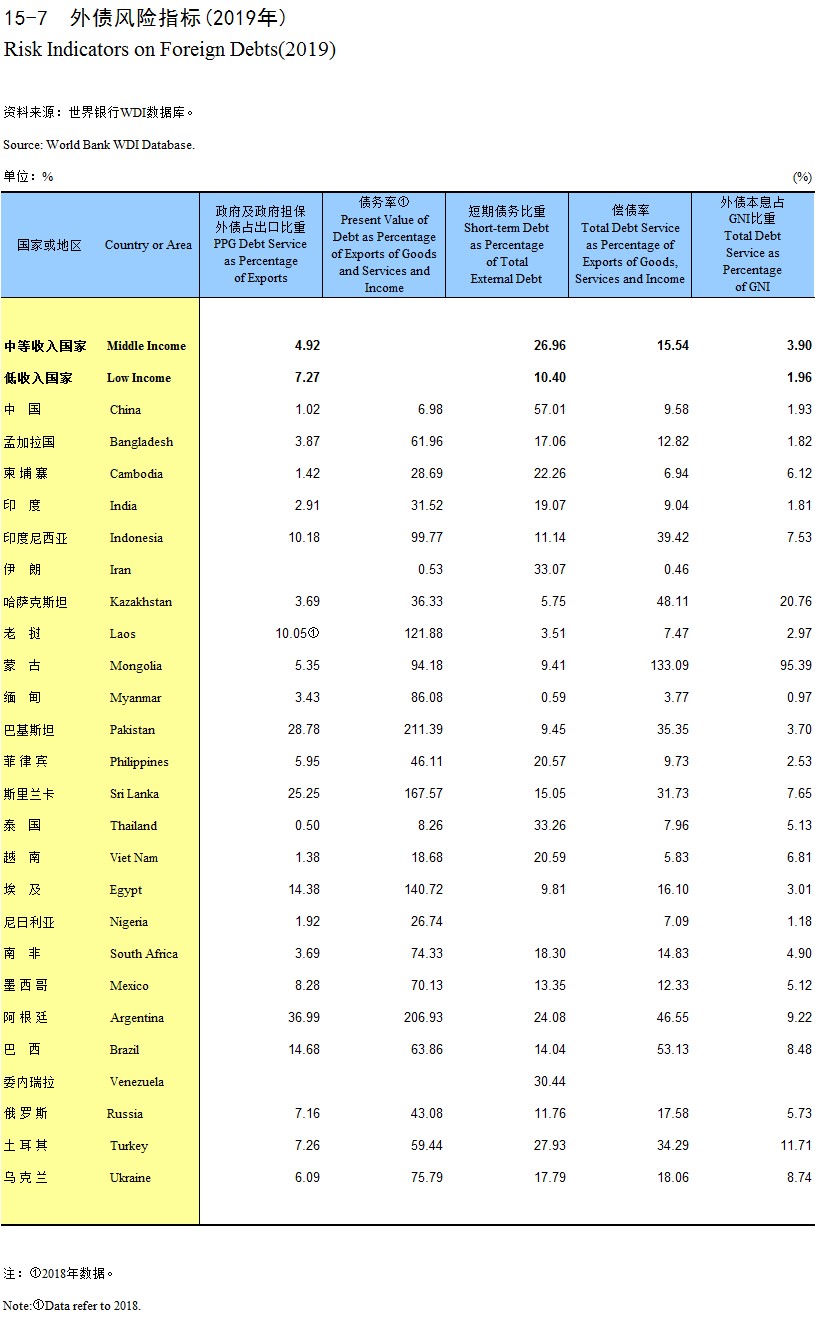
Risk Indicators on Foreign Debts (2019)
Explanatory Notes on Main Statistical Indicators
Education, Science and Technology, Culture and Health
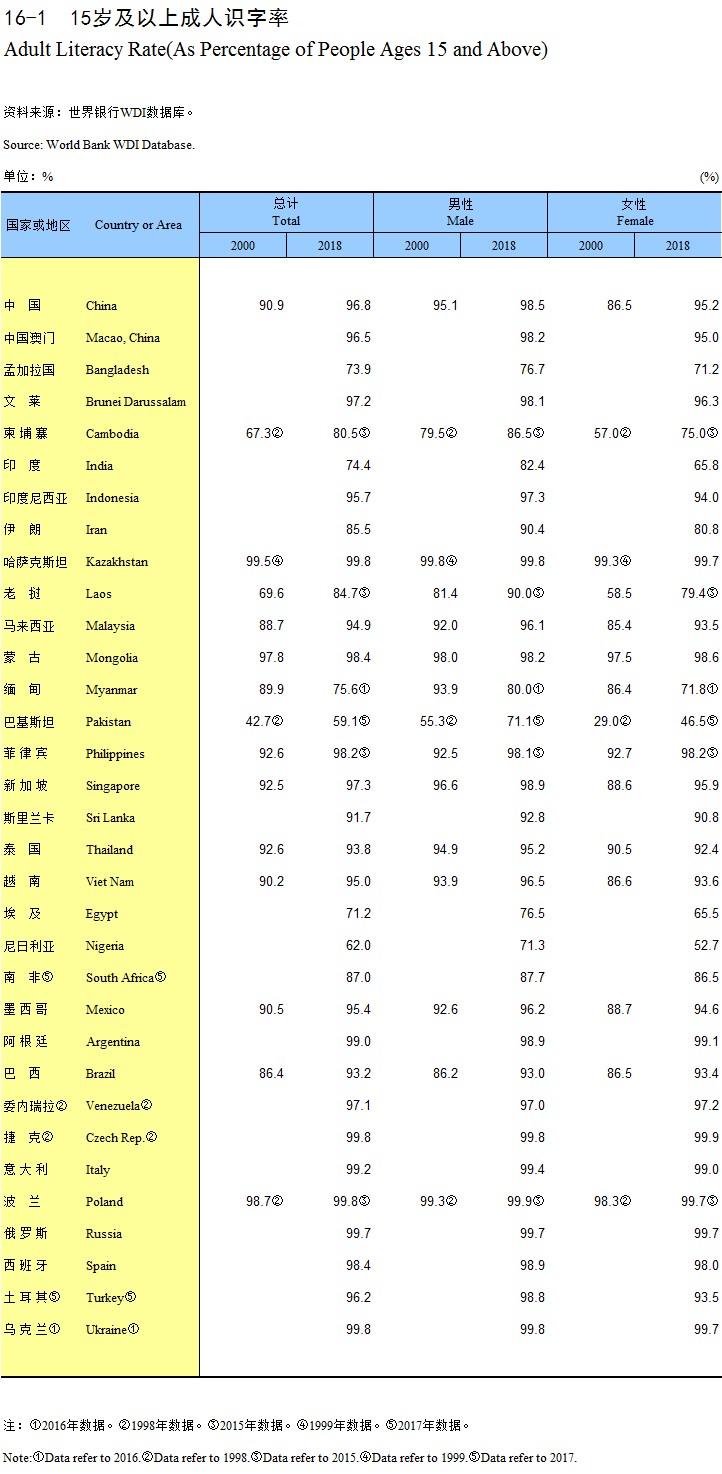
Adult Literacy Rate (As Percentage of People Ages 15 and Above)
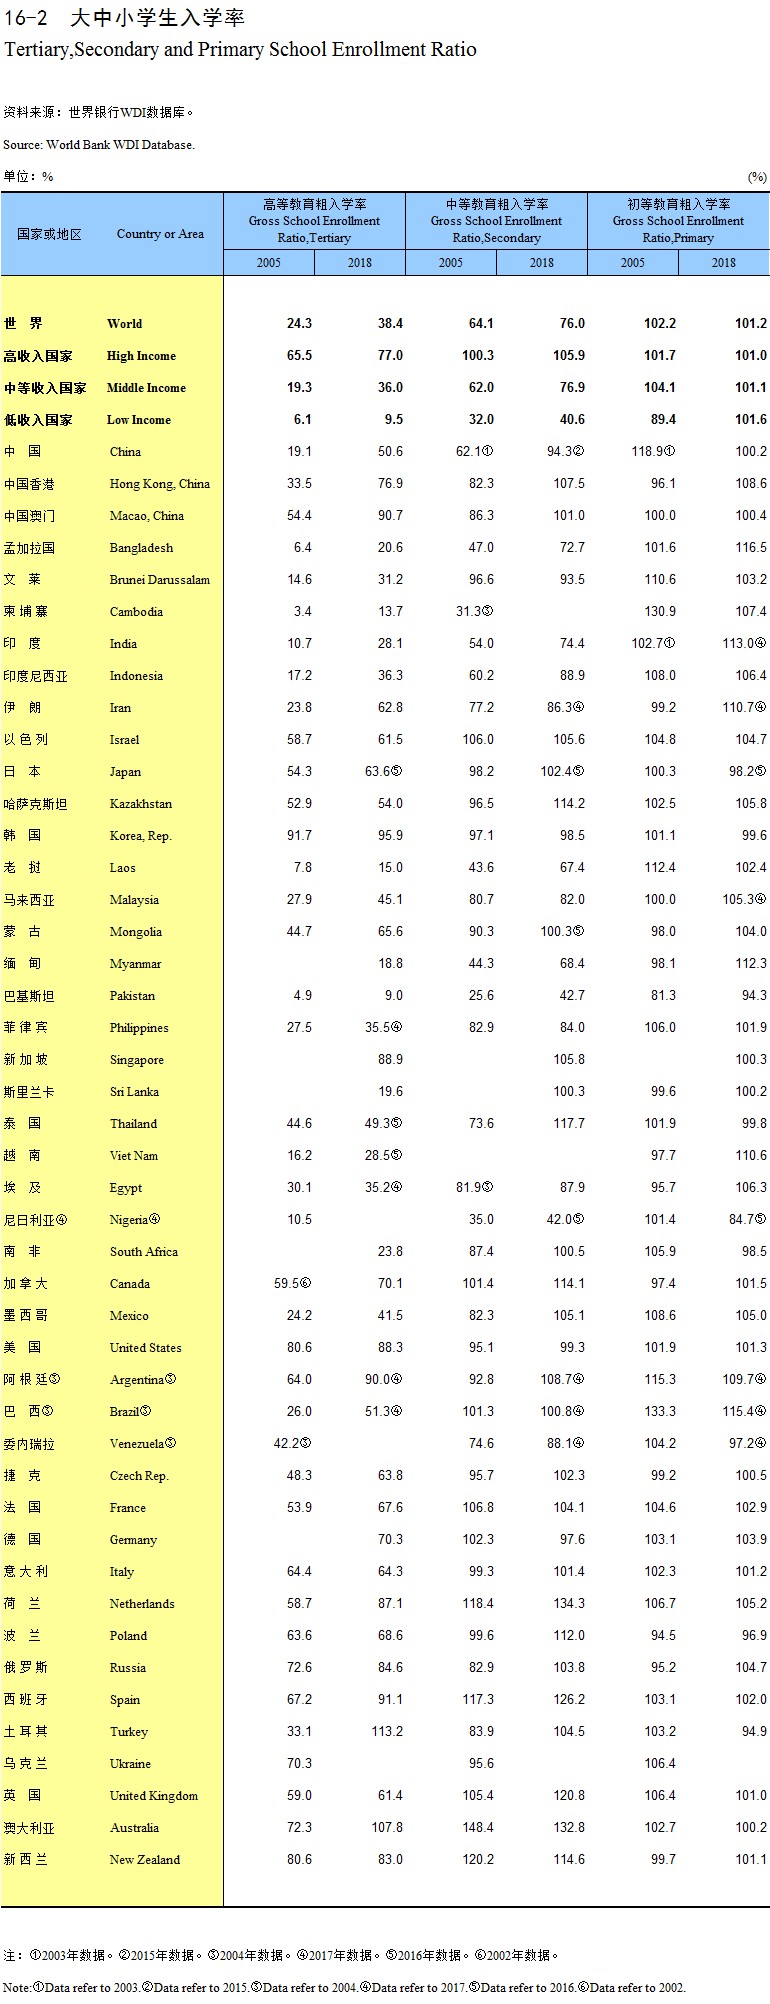
Tertiary, Secondary and Primary School Enrollment Ratio
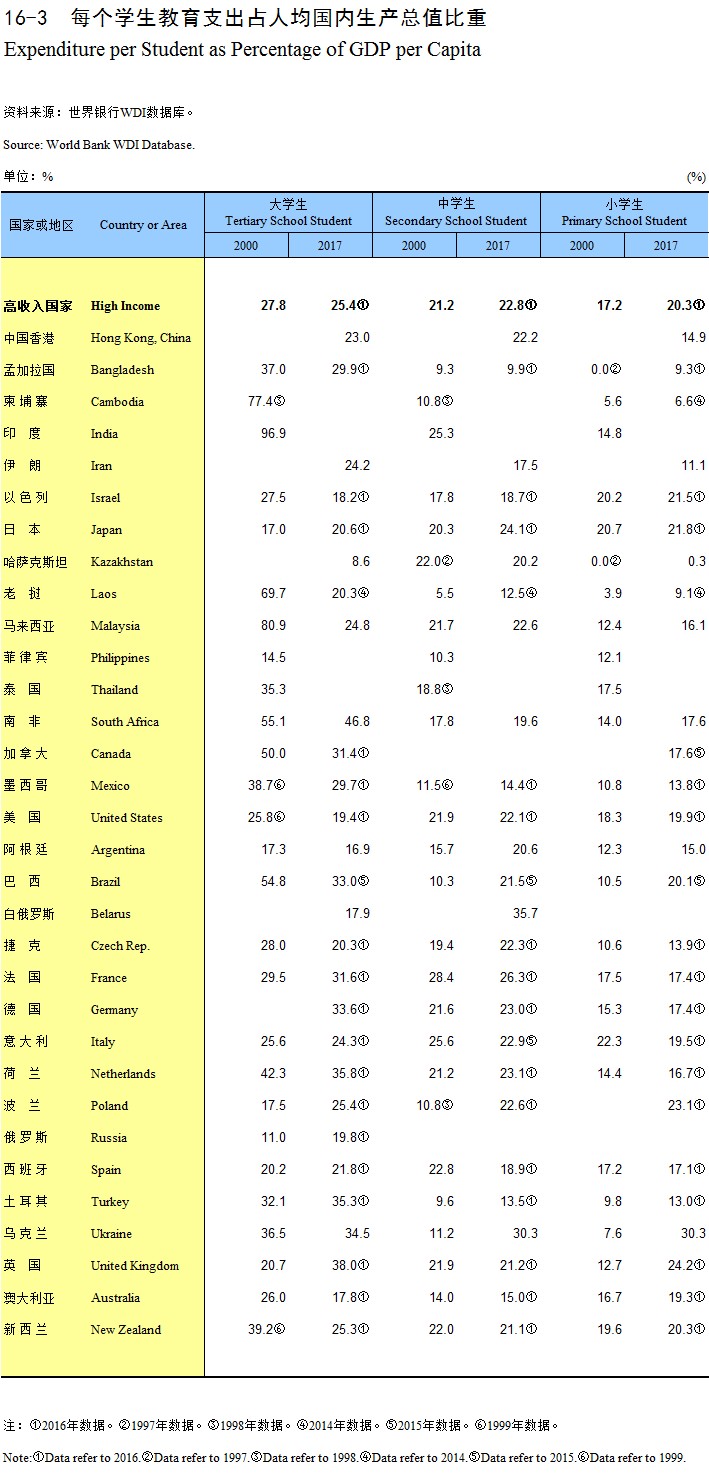
Expenditure per Student as Percentage of GDP per Capita
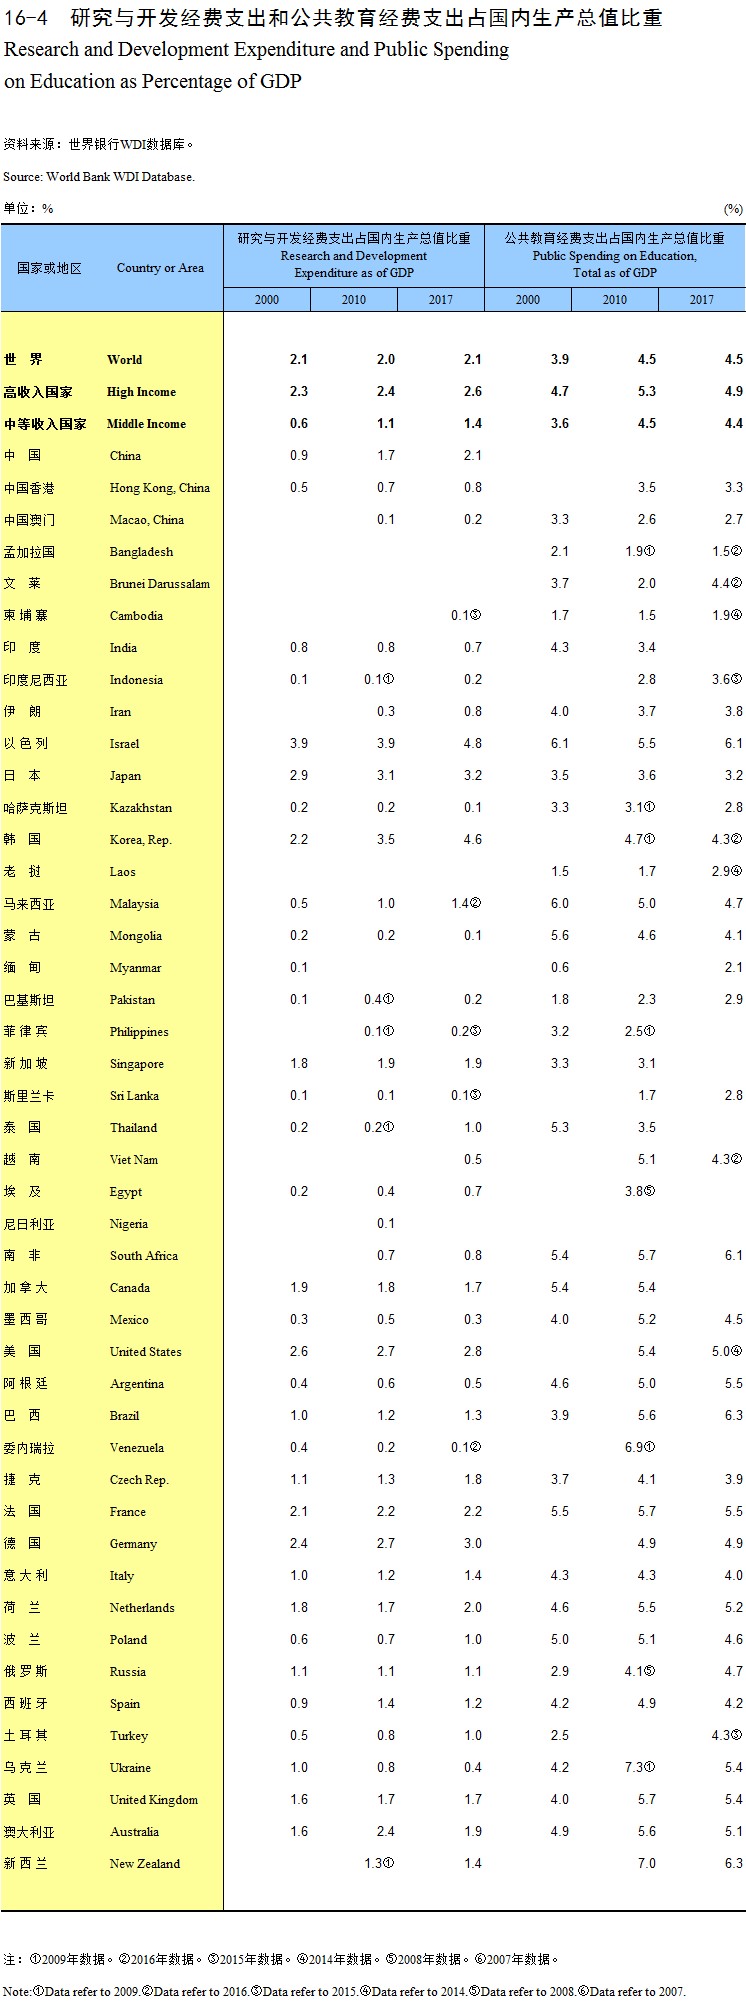
Research and Development Expenditure and Public Spending on Education as Percentage of GDP
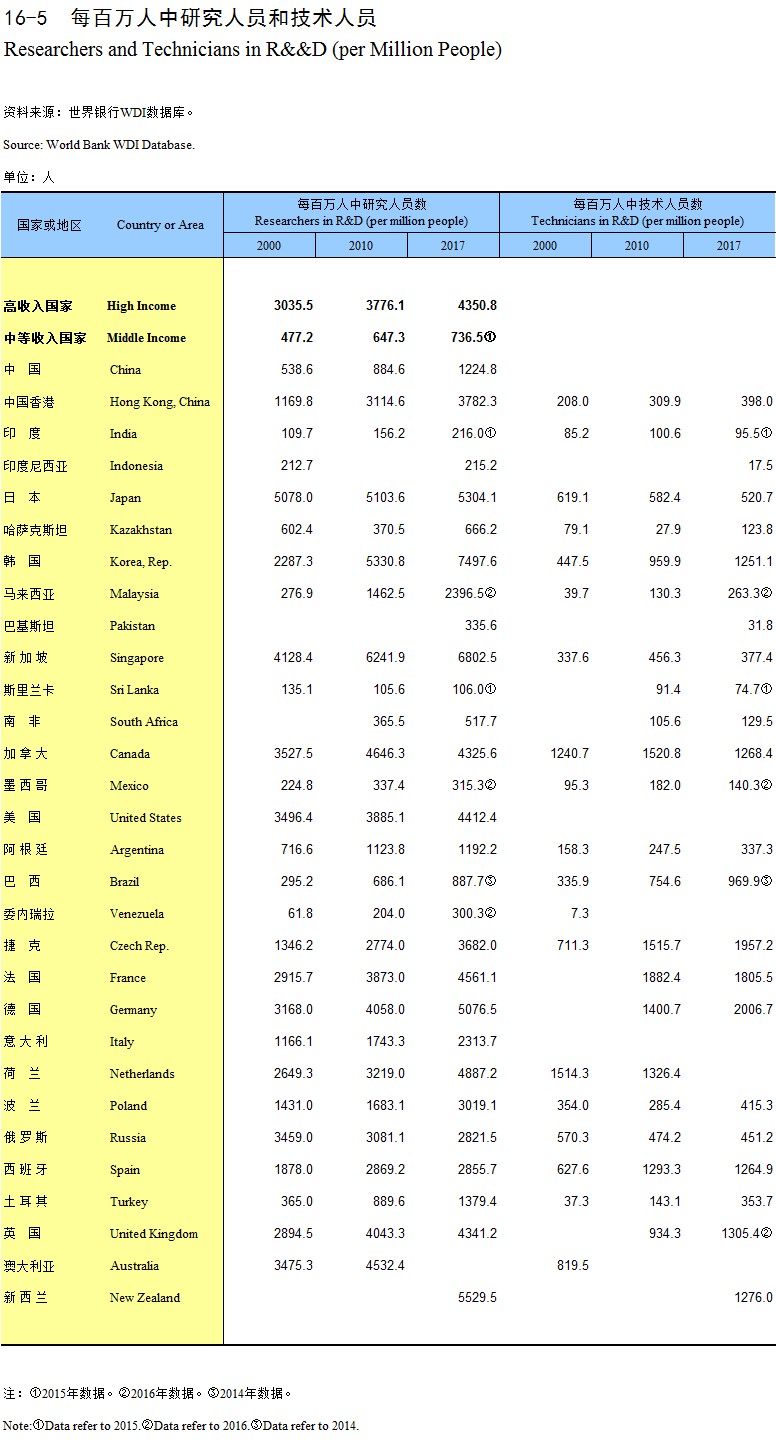
Researchers and Technicians in R&&D (per Million People)
High-technology Exports as Percentage of Manufactured Exports
Patent Applications
Percentage of Population Using at least Basic Sanitation and Drinking Water Services
Health Expenditure as Percentage of GDP and Per Capita Health Expenditure
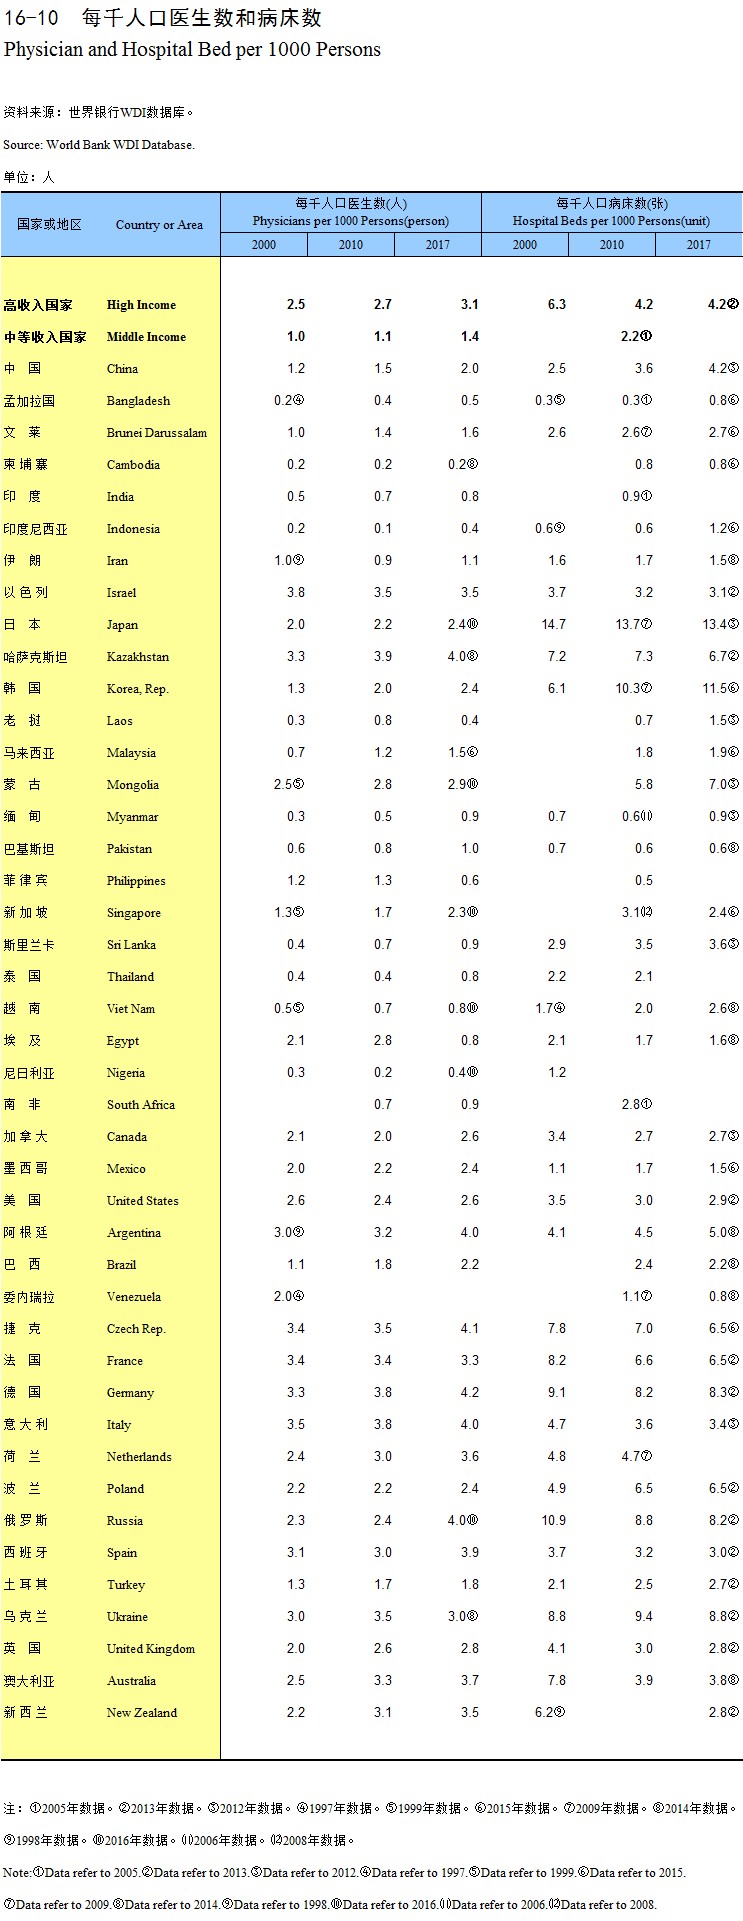
Physician and Hospital Bed per 1000 Persons
Explanatory Notes on Main Statistical Indicators
Comprehensive Evaluation Indicators
Human Development Index (2019)
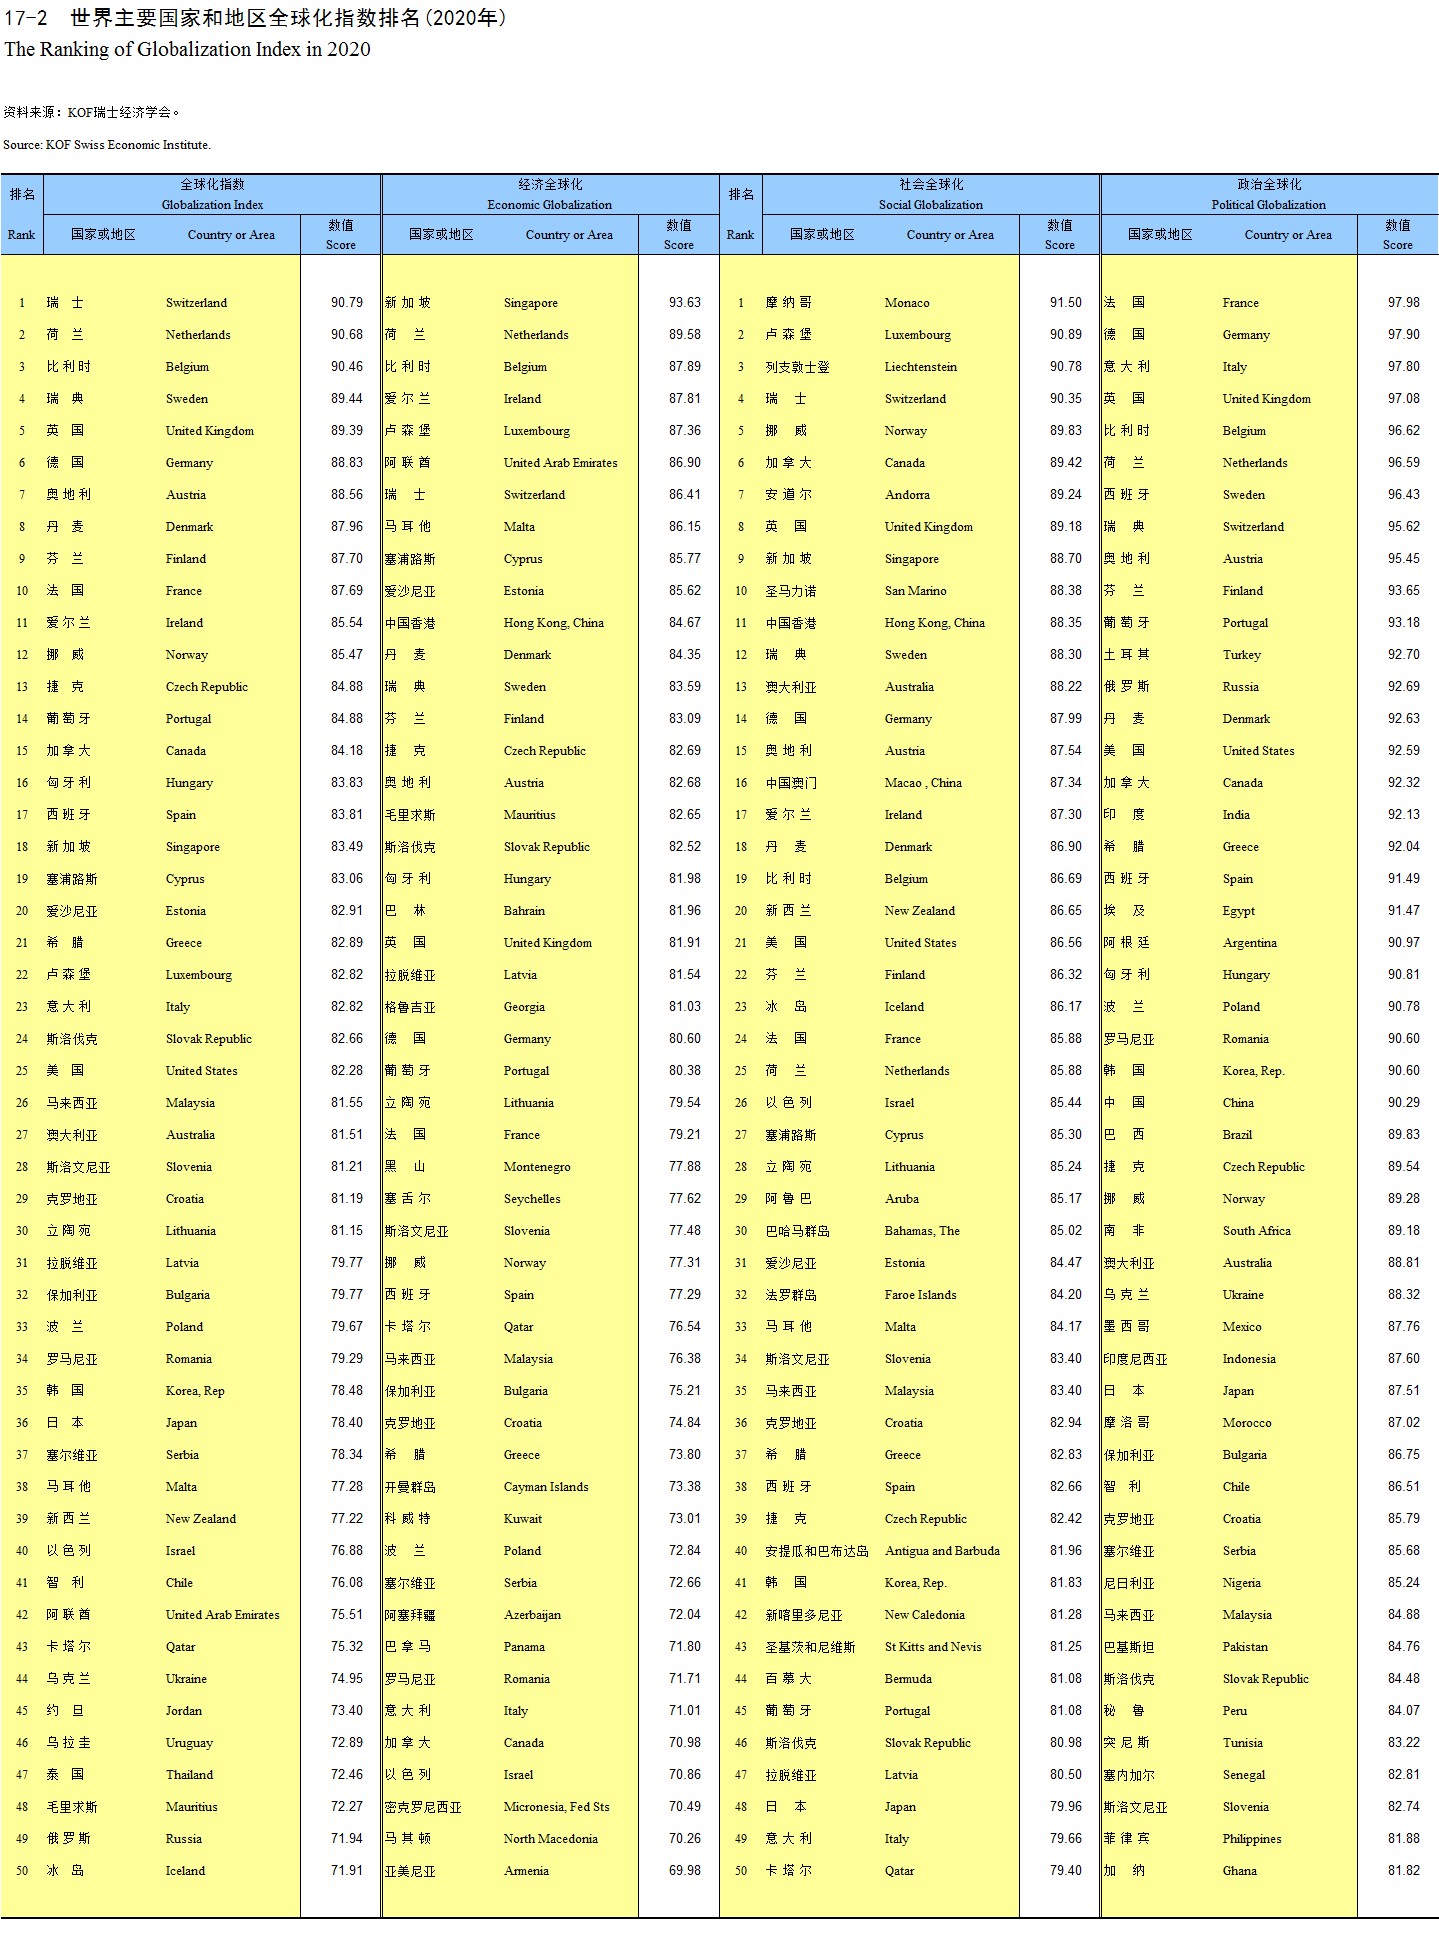
The Ranking of Globalization Index in 2020
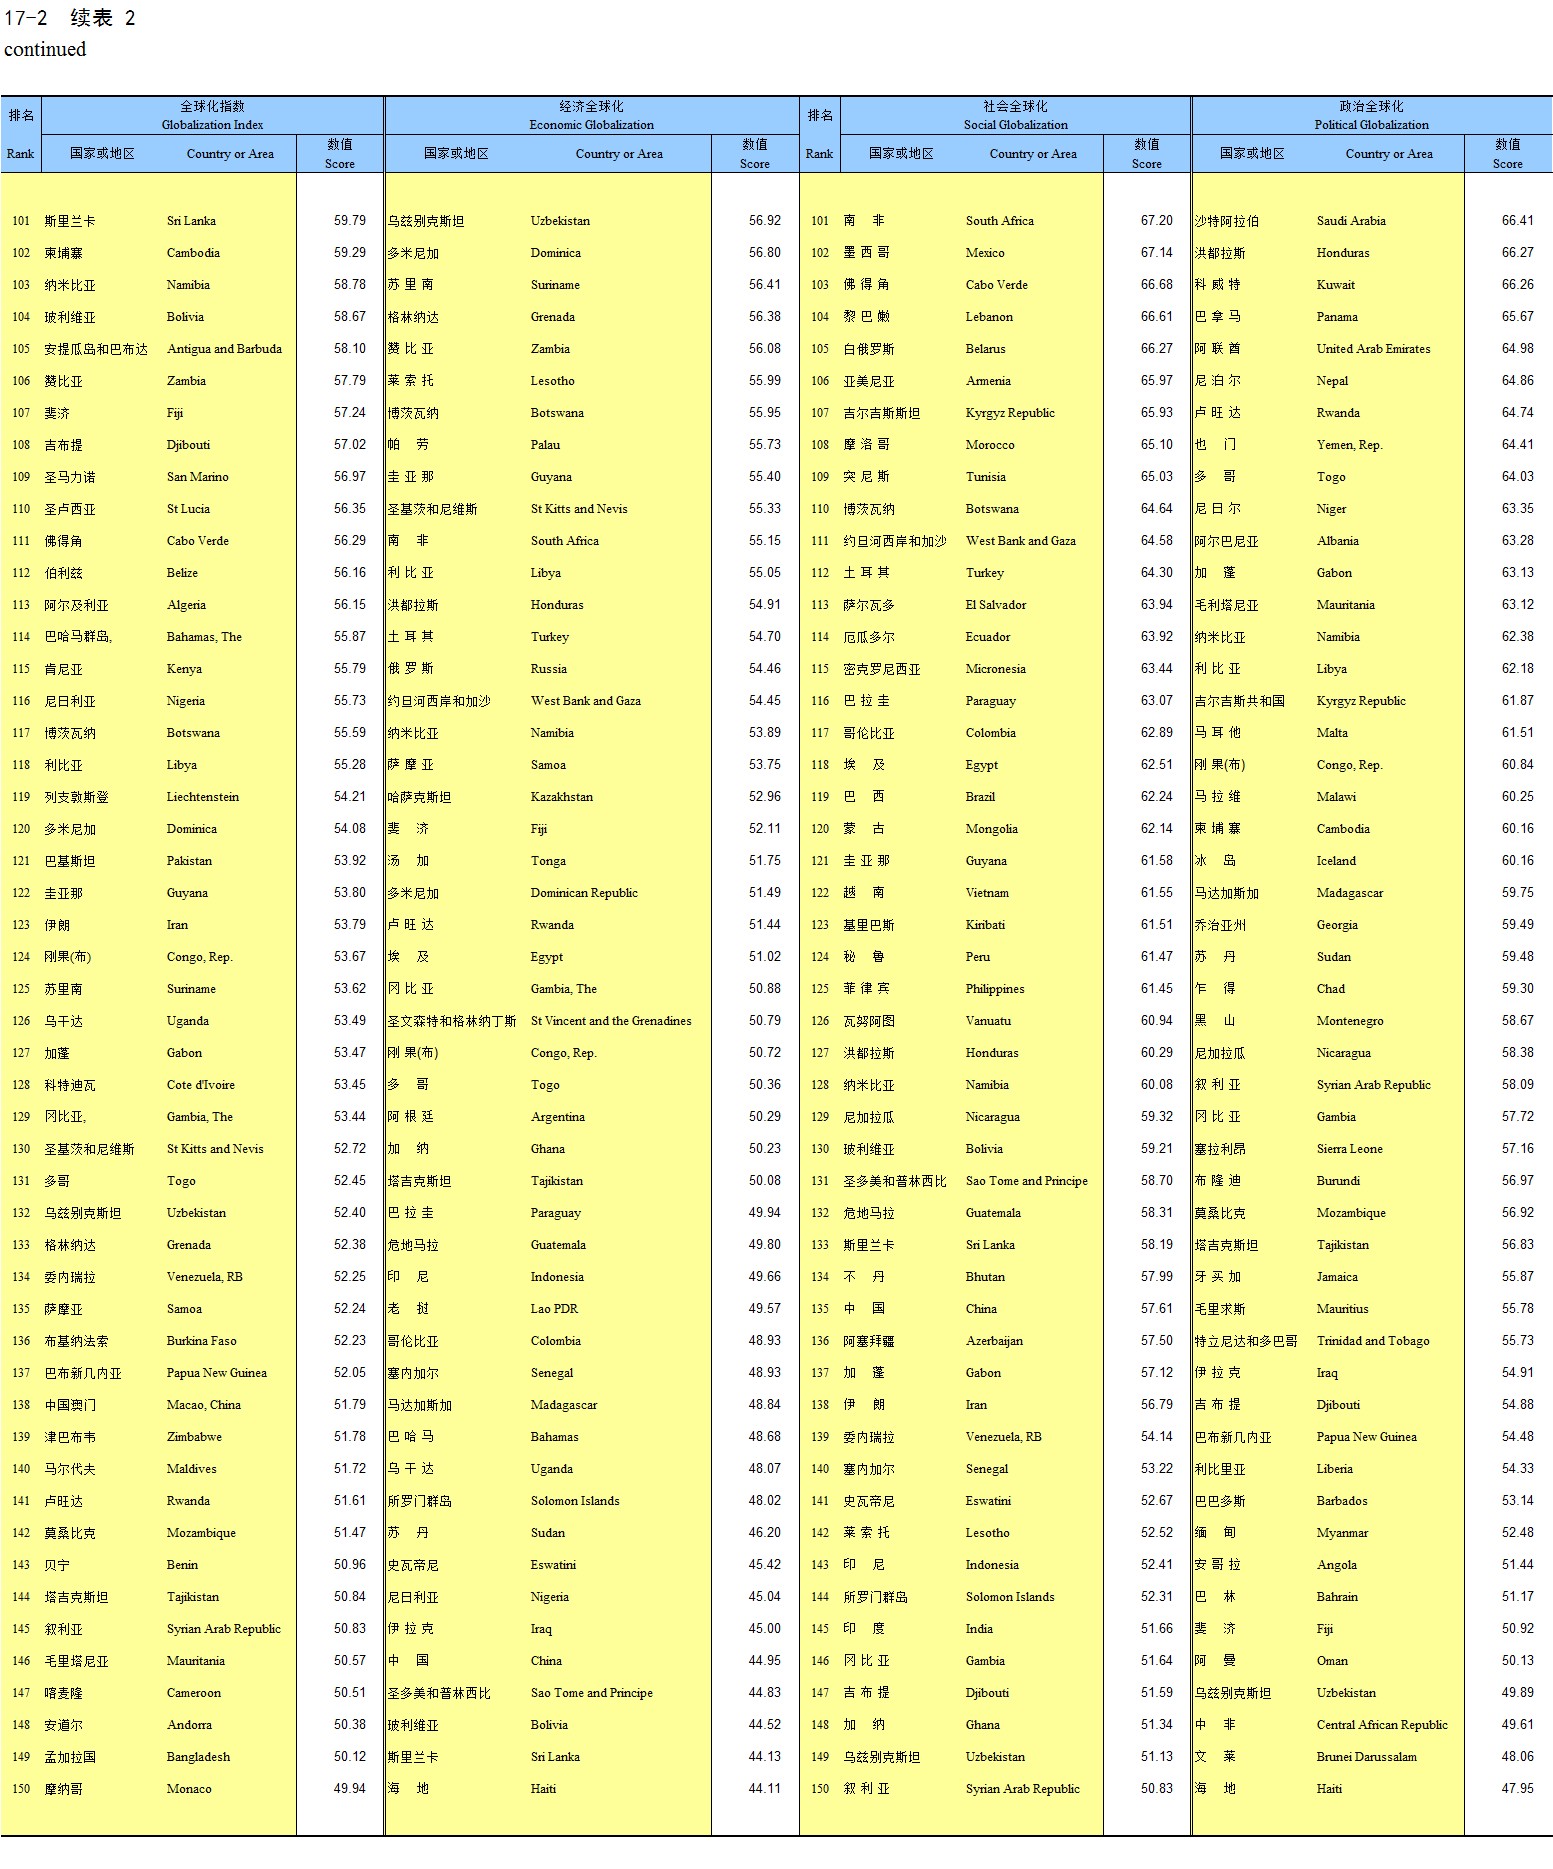
continued
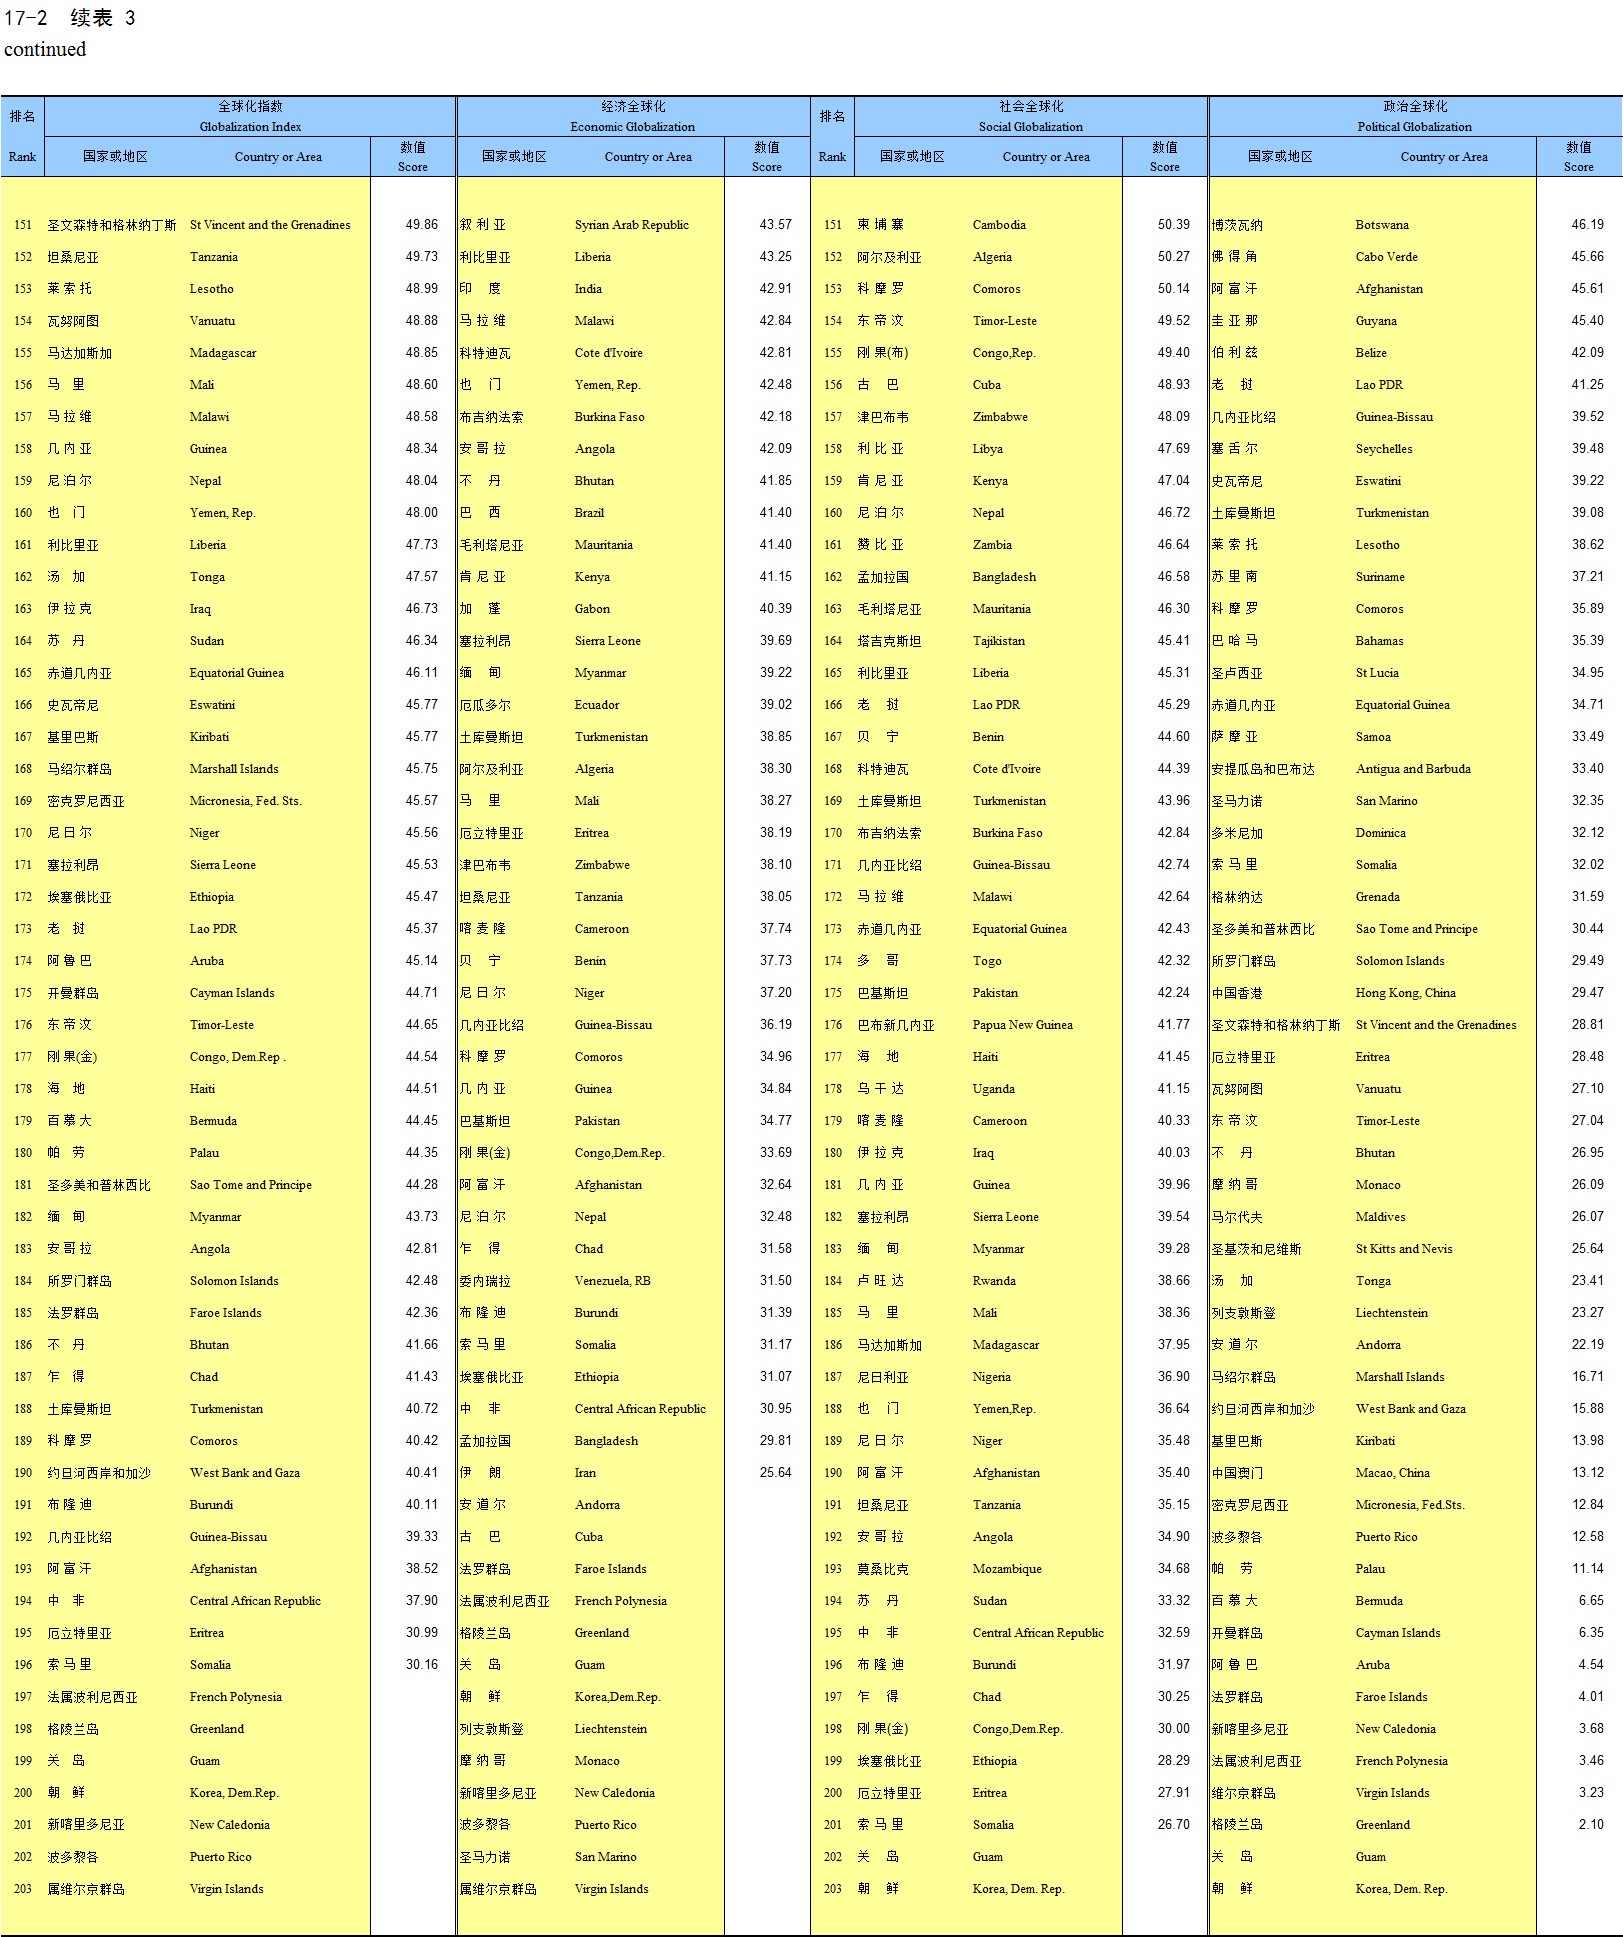
continued
continued
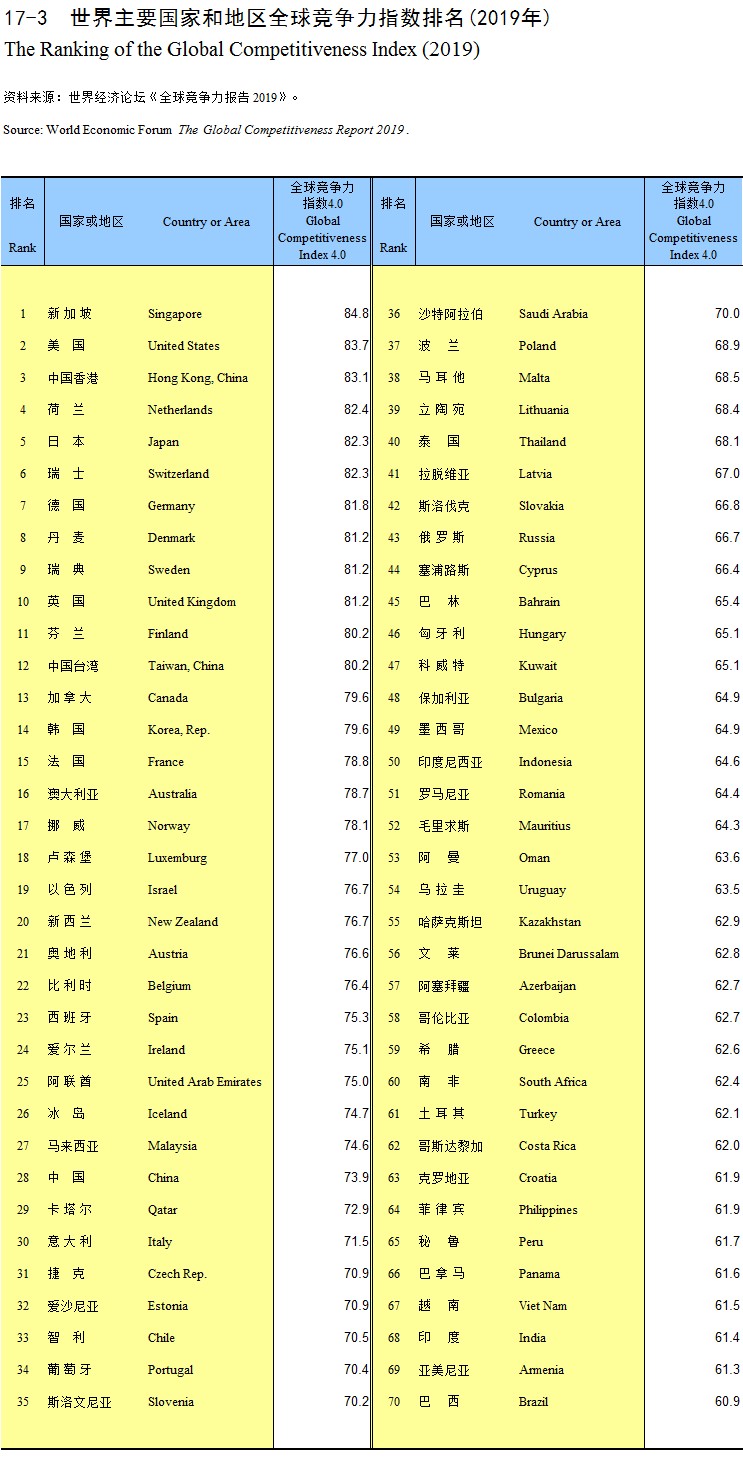
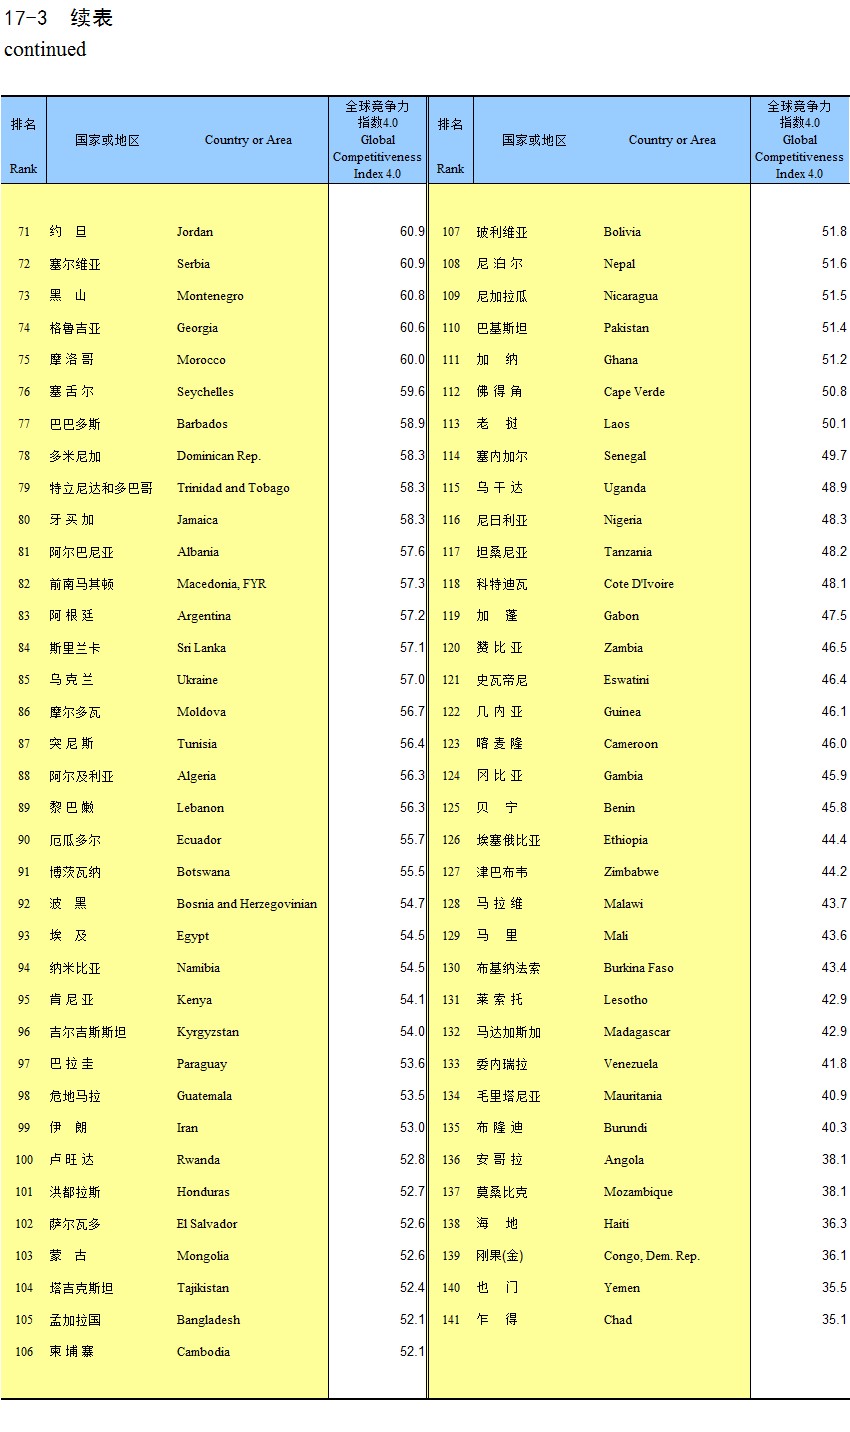
The Ranking of the Global Competitiveness Index (2019)
continued
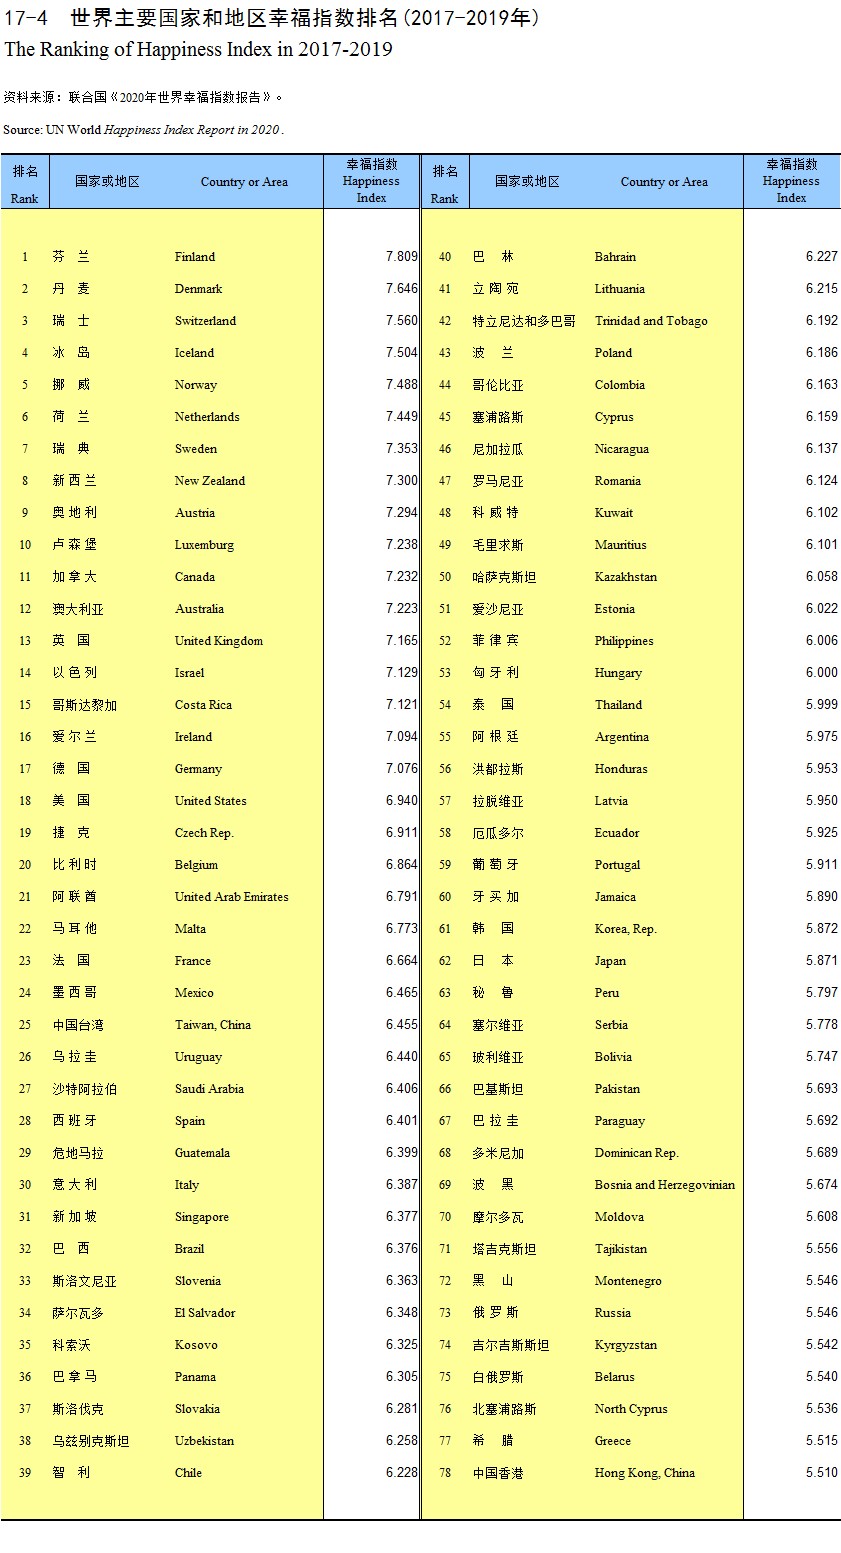
The Ranking of Happiness Index in 2017-2019
continued
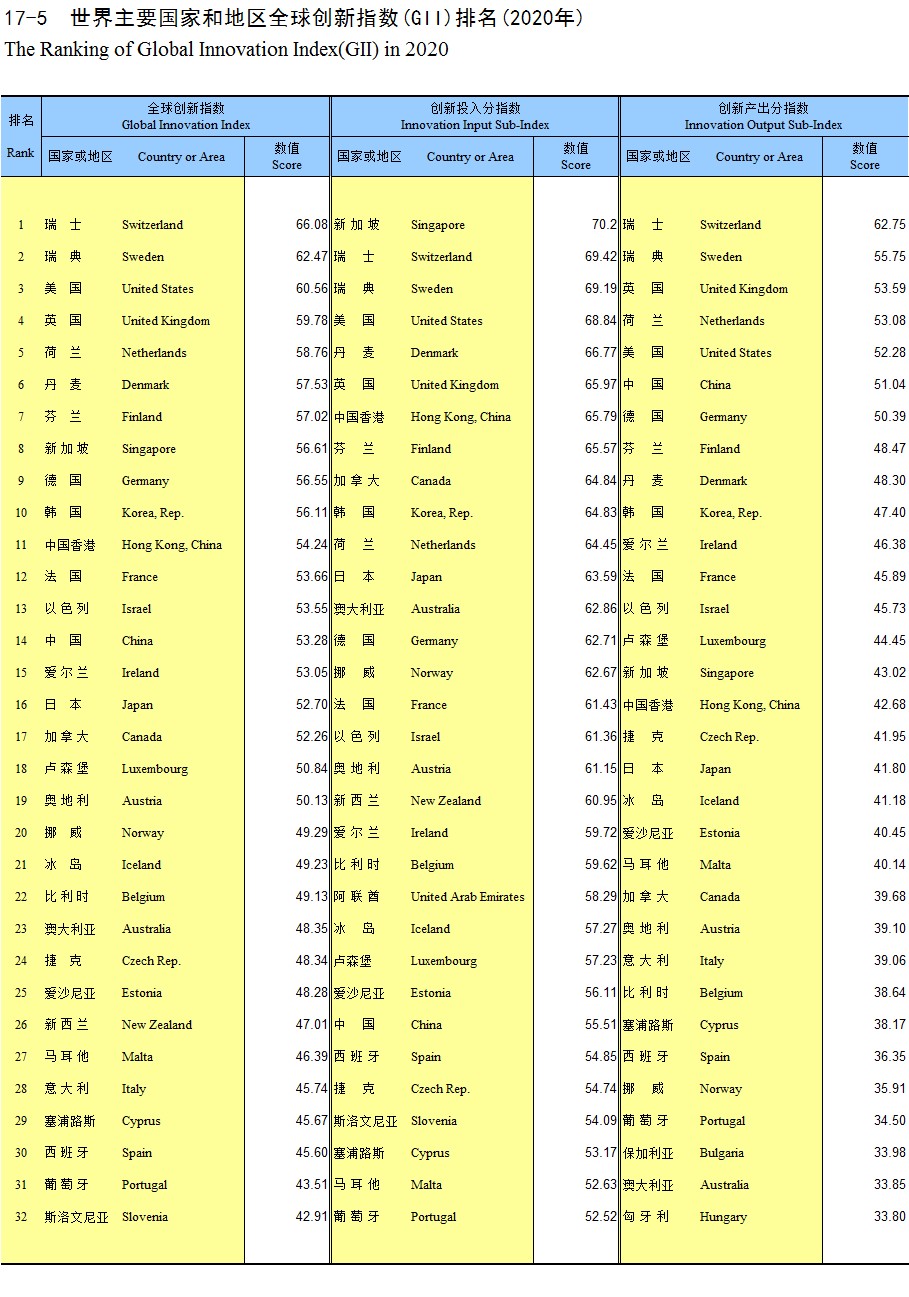
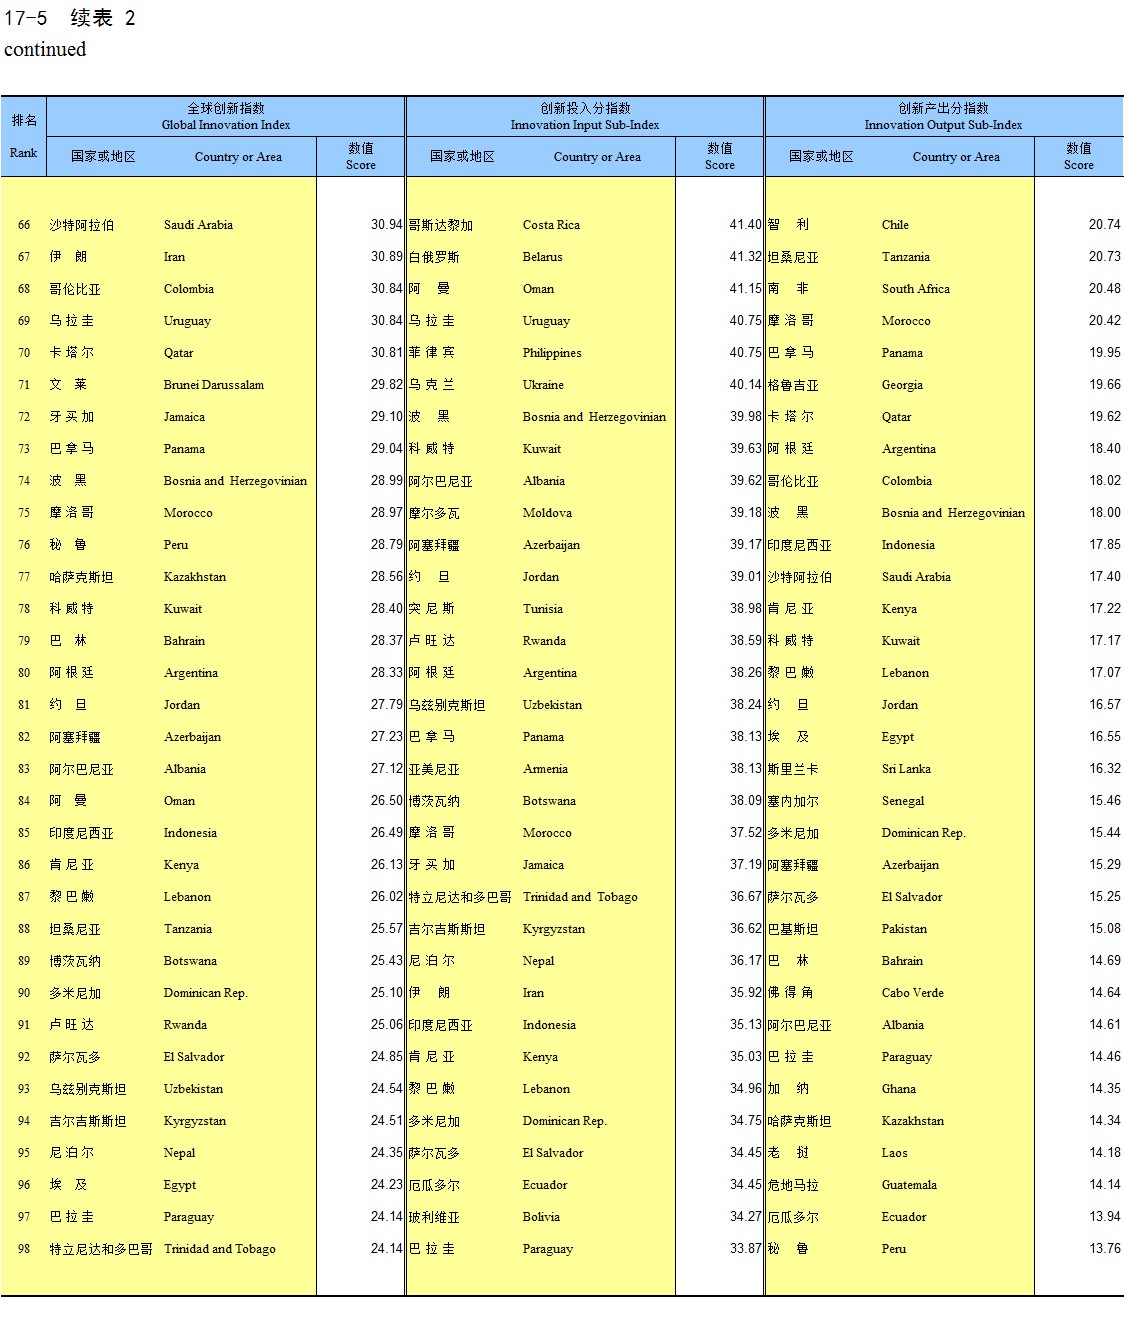
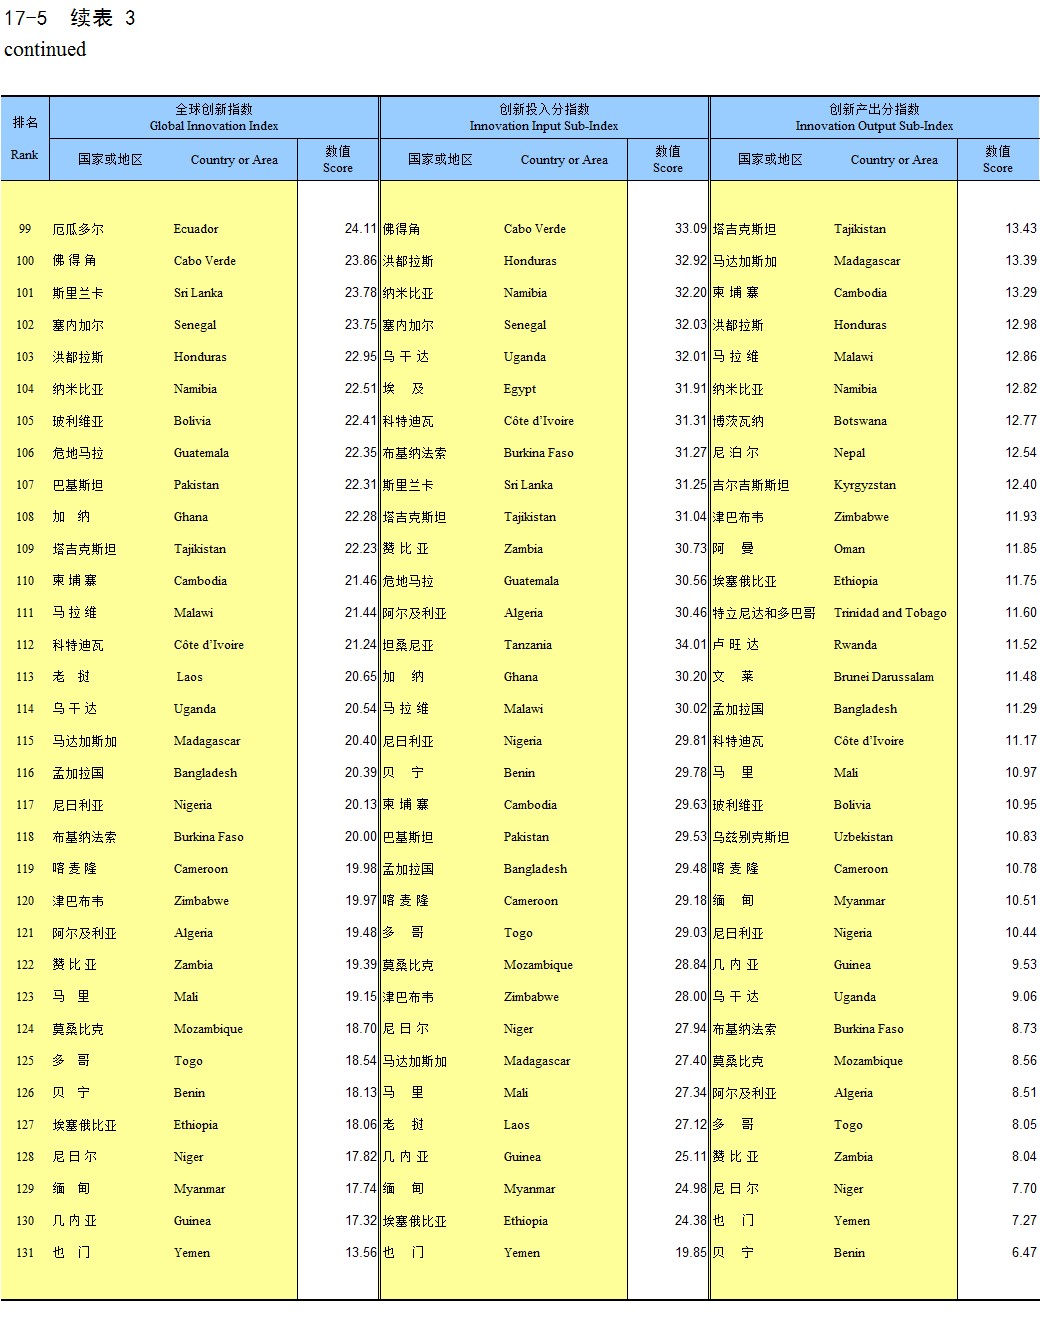
The Ranking of Global Innovation Index (GII) in 2020
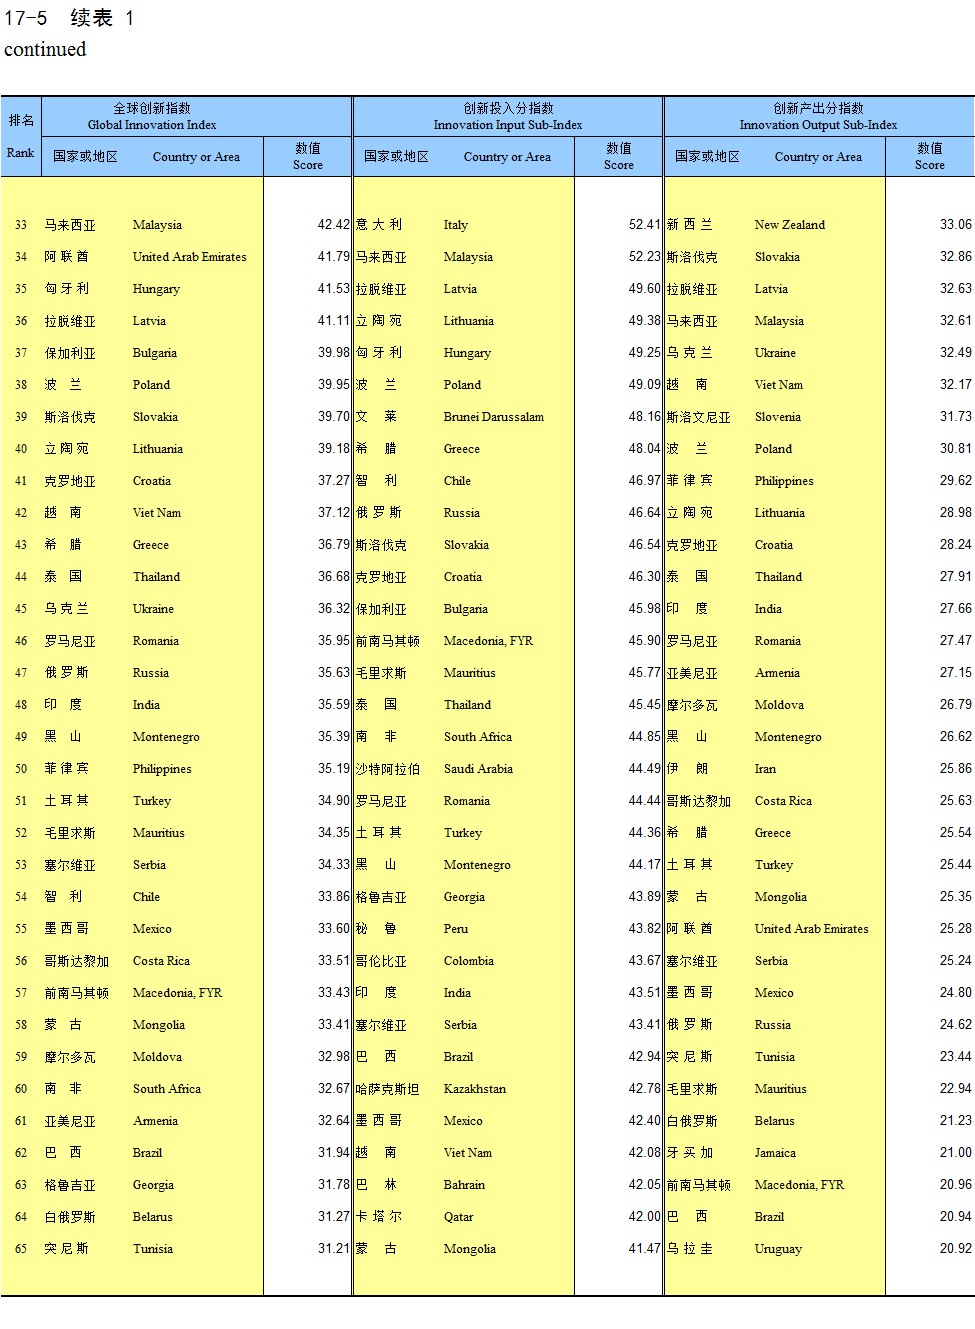
continued
continued
continued
The 500 Largest Companies in the World Sorted by Revenue in 2019
Explanatory Notes on Main Statistical Indicators
Appendix
Appendix1 International Organizations and Abbreviations
中文版
